
Last updated: November 2026
Diffusion of innovations is the framework that explains why some new offerings spread like wildfire while others die in the hands of a few enthusiasts and go no further. If you’ve ever launched something you were certain was better than what already existed, and watched it sell to a small cluster of excited early customers before mysteriously stalling, you’ve lived this model from the inside. By the end of this page, you’ll be able to diagnose exactly which segment your business is currently selling to, recognize why the message that won your first customers is now actively repelling your next ones, and build the evidence your market actually needs before it will move.
Everett Rogers was an assistant professor of rural sociology at Ohio State University when Diffusion of Innovations first appeared in 1962. He drew on more than 500 studies across agriculture, medicine, education, and communications. His core finding: adoption of a new idea in any population follows a bell-shaped curve over time, and the people who adopt at different points along that curve are genuinely different in psychology, risk tolerance, and social behavior, not just early or late versions of the same buyer.
The model has held up for sixty-plus years because it describes something real about how social systems process uncertainty. And for a small-business operator, that’s the useful part: not the academic scaffolding, but the practical fact that your Innovator customers and your Early Majority customers are essentially different species, want different things from you, and cannot be reached by the same pitch.
The idea in 30 seconds
- Diffusion of innovationsset out by Everett Rogers in Diffusion of Innovations (1962), describes how new ideas spread through a market in a predictable bell curve across five adopter segments.
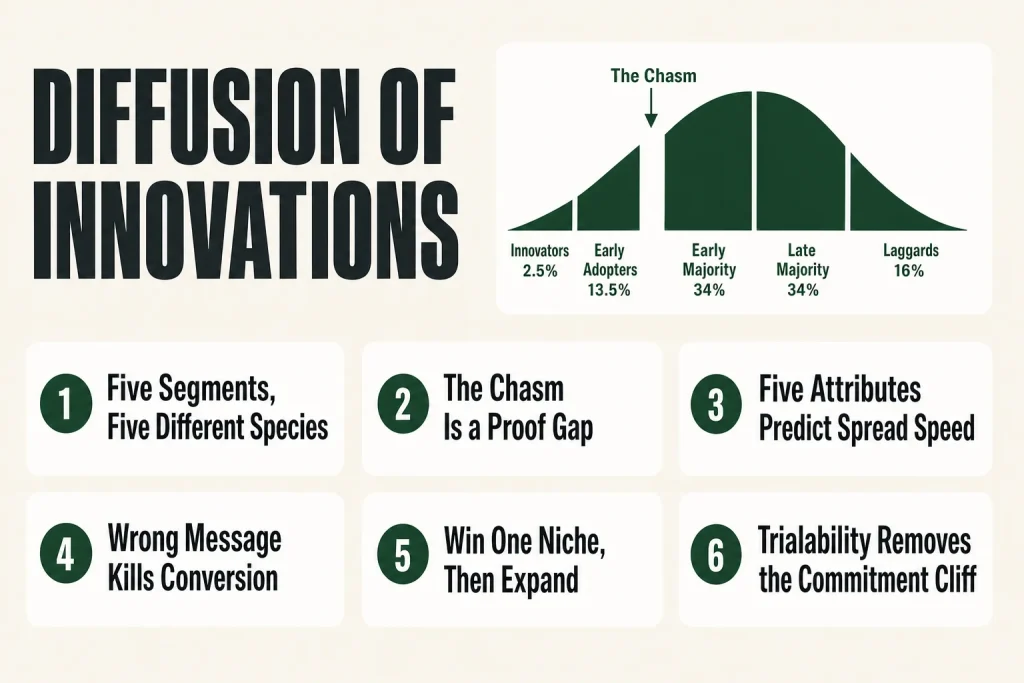
- The five segments are Innovators (~2.5%), Early Adopters (~13.5%), Early Majority (~34%), Late Majority (~34%), and Laggards (~16%), each motivated by different things and each requiring a different message.
- Geoffrey Moore’s Crossing the Chasm (1991) extended Rogers by naming the dangerous gap between Early Adopters and the Early Majority, where most new products stall and die.
- Five attributes of your offer, Relative Advantage, Compatibility, Complexity, Trialability, and Observability, predict how fast it will travel up the curve.
- For operators, the model’s main job is diagnostic: it tells you who you’re currently selling to and whether your message, proof, and channel match that group’s actual buying logic.
- By the end of this page, you’ll be able to identify which segment dominates your current customer base, adjust your messaging to match their decision-making style, and spot when you’re stuck between segments.
Where Diffusion of Innovations Came From
Rogers didn’t invent the idea that new things spread unevenly. Sociologists had been tracking adoption patterns in rural communities since the 1920s, and S-shaped cumulative adoption curves had earlier roots in work on social imitation. What Rogers did in Diffusion of Innovations (1962) was synthesize over 500 diffusion studies across agriculture, public health, education, and communications into a single coherent model that could actually be used to predict and influence how adoption happens.
The book went through five editions between 1962 and 2003, with the fifth published by Free Press. In the mid-2000s, Diffusion of Innovations had become the second most-cited book in the social sciences, according to multiple sources referencing the Social Science Citation Index at that time. That citation standing reflects how widely the framework traveled across fields that rarely agree on anything, though it is worth being clear that this ranking was established as of the mid-2000s and has not been independently re-verified against more recent citation data.
The business world largely ignored Rogers until Geoffrey Moore applied the model specifically to high-tech markets in Crossing the Chasm (1991, revised 1999 and 2014). Moore argued that the transition from Early Adopters to Early Majority isn’t a smooth slide, it’s a credibility cliff. The chasm concept is contested: Rogers reportedly argued that diffusion research doesn’t support a structural gap between specific adopter categories. But the underlying observation, that early enthusiasts and mainstream pragmatists buy for fundamentally different reasons, has held up well in practice.
The Five Segments: Who They Are and What They Actually Want
Rogers divided the bell curve into five segments based on how early a person adopts relative to others in their social system. The percentages that follow are statistical conventions derived from a normal distribution, treat the profiles as more reliable than the exact numbers, which will vary by market and product type.
Innovators (~2.5%)
These are the people who seek out new things for their own sake. They’re comfortable with uncertainty, often technically sophisticated, and willing to debug a half-finished product. They are not representative of your market. They buy because something is new, not because it’s proven. The trap here is building your whole brand around their enthusiasm. They’ll praise you loudly and then immediately move on to the next new thing. That said, they’re enormously useful for surfacing real usage patterns before you’ve finalized anything.
Early Adopters (~13.5%)
This is the group that matters most in the early stages, and they’re often confused with Innovators. The difference: Early Adopters are opinion leaders in their reference group. They adopt because they see a strategic advantage, they want to be ahead of their peers, and they’re making a calculated bet that this will pay off. They’re influential precisely because they’re not reckless gadget freaks. When an Early Adopter recommends something, their peer group listens. This is the group that fueled early Slack growth inside tech companies, and it’s the group whose testimonials your Early Majority will eventually read, but won’t automatically trust.
Early Majority (~34%)
The first mainstream segment, and the one that most growth strategies misread. Early Majority buyers are deliberate. They want proof that something works before they commit. They look for references from people like themselves, not from Early Adopters, whom they view as risk-takers operating in different conditions. They ask ‘who else like me is already using this?’ If you can’t answer that question credibly, you don’t get the sale. This is where most small-business operators find their growth stalling: the Early Adopter messaging that worked brilliantly (‘be first,’ ‘get ahead of the curve,’ ‘see what’s possible’) actively puts off the Early Majority, who interpret that framing as a warning that the product isn’t ready yet.
Late Majority (~34%)
Skeptical by nature, risk-averse, and often price-sensitive. This group adopts when it feels riskier to stay out than to come in. Competitive pressure, industry standards, and cost reductions push them. They need an ecosystem of support, training, integrations, established best practices, before they’ll commit. They are not going to be persuaded by innovation narratives. They want to know that everyone else already uses this and there’s a clear support path if anything goes wrong.
Laggards (~16%)
The last to adopt, if they adopt at all. Laggards are often attached to tradition for practical reasons, they may have deep expertise in existing systems, or face cost or complexity barriers that make switching genuinely difficult, not just psychologically uncomfortable. Some laggards are simply outside your target market and not worth pursuing. Others are waiting for a price point or a simplicity level that doesn’t exist yet. Worth understanding, but rarely worth chasing with heavy marketing investment.
The takeaway for operators: each segment requires a different kind of proof, a different channel emphasis, and a different message. The mistake isn’t failing to reach all five. The mistake is using the same message across all five and wondering why conversion drops off after the first enthusiastic wave.
The Five Attributes That Predict Whether Your Offer Will Spread
Rogers identified five attributes of an innovation itself that predict how fast it will diffuse. These are not audience characteristics, they’re features of your offer as perceived by the target segment. That last word is doing a lot of work. The same product can score high on relative advantage with an innovator and low with a late majority buyer, because the two groups are evaluating it against different alternatives and against different risks.
Relative Advantage
The degree to which your offer is perceived as better than what it replaces. Notice: perceived. Objective superiority is not enough. If your target segment doesn’t believe you’re better, or can’t see clearly how you’re better in terms they care about, the advantage doesn’t exist for them. Relative advantage can be economic, it can be convenience, it can be social status. The job is to identify which dimension matters to this segment and make the advantage visible in those terms. A meta-analysis of 226 adoption studies published between 1996 and 2011, carried out by Kapoor, Dwivedi, and Williams in Information Systems Management (vol. 31, no. 1, pp. 74 to 91, 2014), found relative advantage, compatibility, and complexity to be the three attributes with the most consistent statistically significant relationships to adoption across the literature.
Compatibility
The degree to which the innovation fits with the adopter’s existing values, habits, and past experiences. A product that requires someone to change how they fundamentally work scores low on compatibility and will diffuse slowly, regardless of how good it is. This is why new software tools often penetrate organizations through individual enthusiasts before formal adoption, the compatibility barrier is easier to clear one person at a time than organization-wide. Rogers reported in Diffusion of Innovations (5th ed. Free Press, 2003, p. 221) that the five attributes together explain between 49 and 87 percent of the variance in adoption rates across the studies he synthesized.
Complexity
The perceived difficulty of understanding and using the innovation. Complexity is inversely related to adoption speed. The more time and mental energy a prospect has to invest just to understand what you do, the more will drop off before ever becoming customers. This doesn’t mean your product needs to be simple, it means your explanation of it needs to be. The first three minutes of a prospect’s interaction with your brand, your site, or your pitch need to answer ‘what is this, who is it for, and how does it work?’ in language that doesn’t require existing familiarity with your category.
Trialability
The degree to which someone can experiment with your offer on a limited basis before committing. Freemium models, free trials, samples, and pilot projects all increase trialability. For the Early Majority in particular, who need proof before they buy, the ability to try without risk dramatically shortens the sales cycle. If your business model doesn’t support a traditional free trial, the equivalent might be a low-stakes entry point: a smaller engagement, a workshop, a first-session guarantee, or a money-back offer that removes the felt risk of commitment.
Observability
The degree to which others can see the results of using your innovation. Some products are inherently observable, a bright-orange piece of construction equipment, a logo on a laptop, a visible physical transformation. Others are private, accounting software, a mental health protocol, an internal workflow tool. When observability is low, diffusion slows because the word-of-mouth engine runs on people seeing their peers succeed with something new. The fix for low observability is usually creating deliberate social proof artifacts: case studies, before-and-after comparisons, public testimonials, or integration into visible contexts where others can see the outcome.
Run your own offer against these five. Be honest. Where you score low, that’s your adoption bottleneck, and it’s usually fixable at the marketing and product layer without redesigning the core offering.
The Chasm: What Crossing the Chasm Added to the Diffusion of Innovations Model
Geoffrey Moore’s 1991 book Crossing the Chasm is essentially an extended application of Rogers’ diffusion model to high-tech markets, with one critical amendment: Moore argued that the gap between Early Adopters and the Early Majority isn’t just a statistical transition. It’s a credibility crisis that most products never survive.
The logic runs like this. Early Adopters buy on potential. They’re making a bet that your offer will pay off, and they’re comfortable with that bet even if the product is rough. The Early Majority, however, buys on proof. They want references from people like themselves, not from the visionaries who adopted early, whom they tend to regard as operating in a different risk environment. As Moore argued, the two groups don’t reference each other: a pragmatist doesn’t trust a visionary’s recommendation. So the enthusiastic word-of-mouth from your early customer base, which feels like a great marketing asset, doesn’t automatically transfer to the next segment.
Moore’s prescription was essentially: pick one narrow segment of the Early Majority, win it completely, build the case studies and references you need in that segment, and use those to open the adjacent segment. His term for it was the ‘bowling alley’, knock down the lead pin in one specific niche and let it topple the ones next to it. This strategy is specifically targeted at discontinuous innovations, products that require a change in behavior or workflow, not just incremental improvements on something familiar.
It’s worth being clear about Rogers’ own position: he disputed the existence of a structural chasm between specific adopter categories. His model depicts a smooth bell curve, and he argued the chasm was not empirically supported by the diffusion research record. What Moore identified may be more accurately described as a reference-group credibility gap, not a universal gap that every innovation hits, but a gap that shows up for products requiring significant behavior change and for which the reference communities of early and mainstream buyers don’t overlap.
For operators, the useful thing isn’t to get lost in that debate. The useful thing is to notice whether you’re experiencing the chasm symptom: strong uptake among a small enthusiastic group, followed by a wall. If you are, the Rogers-Moore lens tells you the problem is almost certainly about proof and reference, you have the wrong kinds of customers endorsing you to the wrong next segment. The fix is not better ads. The fix is building the right social proof for the right group.
Putting this to work? The ideas in the Canon are the foundation under the tactical playbook in Build a Complete Marketing Department. Grab the free companion kit at mmsvegas.com/resources.
Diffusion of Innovations in Practice: What It Looks Like Today
Slack is a clean example of a product that navigated the curve deliberately, even if that wasn’t always explicit in the strategy. Early adoption happened inside small tech teams, the Innovator and Early Adopter slice, where individual employees brought the tool in and used it without formal IT approval. The product’s high observability (you either see teammates using it in meetings or you don’t) and low complexity (it’s a chat tool) kept the compatibility barrier low. The chasm crossing happened when Slack shifted its story from ‘better communication for tech teams’ to ‘this is now how professional teams work’, a reframe aimed specifically at the Early Majority’s need for peer-validated proof rather than early-adopter enthusiasm.
Dropbox ran a similar arc. The initial growth was among technically comfortable users who saw an obvious advantage over emailing files to themselves. The mainstream-crossing moment came when Dropbox was able to point to companies their size using it, and when the product integrated cleanly with existing workflows rather than demanding that people change how they organized files from scratch. Compatibility and observability did the work.
For small-business operators, the examples don’t have to be billion-dollar products. Consider an independent consultant who spent a year landing early clients who were excited to try a new engagement model, then hit a wall when referrals weren’t converting. The likely problem: the existing clients are Early Adopters who sent referrals to other Early Adopters, but the consultant is now reaching out to a more pragmatic segment that needs case studies, structured methodologies, and social proof from businesses like theirs, not enthusiasm from risk-tolerant early clients. That’s the chasm at a small-business scale, and it’s very common.
The model also explains category-level behavior. Contactless payment took years to gain traction in the US despite being technically available, partly because observability was low (people weren’t watching each other pay at the register in ways that made the behavior contagious) and partly because compatibility was poor, Americans were used to swiping, not tapping, and ‘tap to pay’ required a small but real behavioral shift. When the pandemic changed the perceived risk of touching shared surfaces, the compatibility and relative advantage equations shifted overnight, and adoption jumped. Same technology. Different perceived attributes. That’s Rogers’ model working in real time.
Where Diffusion of Innovations Is Most Useful for Operators
The model earns its place in your toolkit in a specific set of situations. Know when you’re in one of them.
Launching something genuinely new. If you’re introducing a category or a significantly different approach, not a slight improvement on something familiar, the diffusion model is your roadmap. It tells you to start with the smallest viable segment of Early Adopters, get them to visible success, build documented proof from them, and use that proof to access the Early Majority. Trying to market to everyone from day one will burn budget and generate weak conversion from every segment.
Diagnosing a stall. If you have a product that sold well early and then slowed, without an obvious product or pricing problem, this model is the diagnostic. The question to ask: ‘Who are my current customers, really? Are they Early Adopters who are now recommending me to other Early Adopters, while the larger Early Majority segment waits for different proof?’ If yes, the fix is building that proof, not increasing ad spend.
Messaging decisions. The language that works for each segment is genuinely different. ‘Be an early adopter’ and ‘get ahead of the curve’ work on Early Adopters and actively put off Early Majority buyers, who interpret those phrases as ‘this product is not yet mainstream and you’d be taking a risk.’ Early Majority messaging centers on peer validation: ‘Here’s how businesses like yours are using this. Here are the results they got.’ Late Majority messaging is about risk elimination: ‘This is now the standard. Here’s the support structure if you need help.’
Pricing and offer structure. Trialability is a lever you control. If adoption is slow, adding a low-risk entry point, a pilot engagement, a free tier, a money-back guarantee, a sample, often moves people who were stalled at the consideration stage. The five-attribute audit tells you whether complexity or compatibility is the real bottleneck, in which case better onboarding or integrations will do more than price changes.
Channel selection. Early Adopters are found through communities of practice, niche publications, LinkedIn niches, and personal networks. Early Majority buyers are found through industry associations, peer referrals, established media, and case studies in channels they already trust. Same company, different channels, depending on where you are in the curve.
Where the Model Breaks Down
Rogers’ framework is built on research conducted mostly in rural agricultural communities, healthcare adoption, and technology diffusion in defined social systems. It was not designed for markets with extremely fast cycles, viral network effects, or platforms where the value of the product depends on how many others are already using it.
Network-effect products don’t follow a smooth bell curve. Platforms like WhatsApp and TikTok can jump from Early Adopter to mass adoption in compressed timeframes because each new user increases the value of the platform for all existing users, a dynamic Rogers’ model doesn’t fully account for. The S-curve still applies at the cumulative level, but the speed of the middle portion is dramatically different from non-network products.
The chasm concept, specifically, appears to be less applicable to continuous innovations, improvements on existing, familiar products rather than genuinely new behaviors or workflows. If you’re selling a better version of something people already buy, the credibility gap between adopter segments is smaller. The reference communities partially overlap. You don’t need to ‘cross a chasm’ so much as earn preference over the incumbent, which is a different strategic challenge.
The model is also less useful when the market is highly consolidated and buying decisions are made by procurement committees rather than individual adopters. In complex B2B sales with long committee-driven evaluation cycles, the Rogers segmentation gives you useful background color but doesn’t map directly to the individuals in the room. A CFO, a head of IT, and an end-user evaluator are playing different roles in the adoption decision, and treating them as if they’re at different points on the curve simultaneously is an oversimplification.
Finally, the percentage splits should be treated as approximations. Rogers derived them from a normal distribution applied to adoption timing, but the actual size of each segment varies considerably by market, by geography, and by how ‘innovation’ is defined for that category. Use the segments as archetypes, not as market sizing tools.
What People Get Wrong About Diffusion of Innovations
‘My early customers represent my market.’ They don’t. Early customers are almost always disproportionately drawn from the Innovator and Early Adopter segments. Their enthusiasm, their tolerance for rough edges, and their willingness to figure things out are atypical. Building your product, your pricing, and your messaging around their behavior will optimize you for a group that represents maybe 16% of potential buyers and will not reliably predict what the larger segments need.
‘The chasm is universal.’ Moore’s chasm concept, while useful, specifically applies to discontinuous innovations, things that require a change in behavior or workflow. For incremental improvements on familiar products, the transition between adopter segments is much smoother. Applying the chasm framing to a product that’s essentially ‘a better version of what you already use’ leads operators to over-engineer the crossing strategy when what they actually need is simpler: more proof, better distribution, or a tighter value proposition.
‘All five segments can be reached with one campaign.’ Rogers’ whole point is that they can’t. Each segment has a different risk tolerance, a different reference community, and a different definition of ‘proof.’ A campaign that works for Early Adopters (novel, forward-looking, emphasizing potential) will actively signal to Early Majority buyers that the product isn’t ready for them. The message must shift with the segment.
‘Innovators are the most valuable early customers.’ Early Adopters are more valuable early customers than pure Innovators in most cases, because Early Adopters have social influence within mainstream networks. Innovators are valuable for product feedback and for being the first visible proof of concept, but they typically don’t have the credibility with mainstream buyers that Early Adopters do. The distinction matters for who you actively recruit as customers versus who you simply accept as customers.
‘High relative advantage guarantees fast diffusion.’ Rogers was explicit: perceived advantage is necessary but not sufficient. A product can be objectively and demonstrably superior and still diffuse slowly if it scores low on compatibility or complexity. The five attributes interact. Address the bottleneck attribute, not just the strongest-performing one.
Common Mistakes
- Running Early Adopter messaging into an Early Majority audience. Audit your active campaigns and ask a simple diagnostic question: does this message assume the reader already wants to try something new, or does it prove that people like them already have? If it’s the former and your customer base has matured past the Early Adopter slice, replace novelty language (‘be first,’ ‘get ahead of the curve’) with peer-validation proof, specific case studies from businesses that look like your target, not testimonials from risk-tolerant early buyers.
- Keeping the same channels after the customer base shifts segments. Map where your last ten new customers actually came from and compare it to where you’re spending marketing budget. Early Adopters find you through niche communities, LinkedIn conversations, and personal referrals from other early types. Early Majority buyers respond to industry association content, peer referrals within their own vertical, and case studies in outlets they already trust. If the source of your best new customers has shifted but your budget hasn’t, you’re funding the wrong distribution system.
- Adding more ad spend when growth stalls after a strong early run. Before increasing spend, run the chasm diagnostic: are your current satisfied customers endorsing you into their own Early Adopter networks rather than to the pragmatic next segment you’re trying to reach? If yes, more impressions won’t fix a proof problem. The operational move is to identify three to five customers who match your target Early Majority profile and commission proper case studies with real numbers from them. Then redirect spend toward channels where that segment actually pays attention.
- Pricing and offer structure that creates a commitment cliff for cautious buyers. If your first engagement requires a large upfront commitment and you’re selling to an audience that’s mostly Early Majority or later, you’re asking risk-averse buyers to skip the trial step entirely. Add a low-stakes entry point: a diagnostic session, a pilot phase, a money-back guarantee on the first module, or a free tier with a clear upgrade path. The goal isn’t to discount, it’s to remove the felt risk of the first step so cautious buyers take it.
- Broadening the pitch when conversion from a new segment stalls. Narrowing is the counterintuitive move. Pick the one sub-segment of the Early Majority where you have or can build the strongest existing proof, same industry, similar headcount, same geography if relevant, and win it completely before expanding. A tighter niche means faster proof accumulation, more resonant testimonials, and a clearer reputation in that slice. Use that foothold to step into adjacent niches, rather than diluting your message across all of them at once.
Operator’s Take
Before you do anything else with this model, answer one operational question: which segment am I actually selling to right now? Pull your last twenty closed deals or customer conversations. Look at how those people talk about you in reviews, in referral emails, in support tickets. Are they excited about the novelty? Comfortable figuring things out before the docs are finished? That’s Early Adopter behavior. Or are they asking for case studies upfront, wanting to speak with an existing customer before signing, insisting on a pilot before a full commitment? That’s the Early Majority. The answer to that one question determines your message, your proof requirements, and which channels will actually convert. Get it wrong and six months of solid execution produces mediocre results, because you’re optimized for the wrong species.
Once you’ve placed yourself on the curve, the most immediately useful move is a five-attribute audit of your own offer. Do it from the outside in. Set a timer for thirty seconds and read your homepage headline as if you’ve never heard of your company. Can a stranger tell what you do, who it’s for, and what it replaces? If not, you have a complexity problem, and no amount of ad spend fixes that, it just sends more confused people to a confusing page. Complexity and compatibility are the two attributes that consistently bite operators, because familiarity blinds you to both. A bookkeeping firm we worked through this exercise with discovered their headline led with their software stack (‘Powered by Xero and Dext’) rather than the client outcome (‘Month-end close in 48 hours, guaranteed’). One change, three times as many inquiry form completions in the following month.
On trialability: if you’re in a service business and adoption is slower than the quality of your work warrants, ask whether there’s a low-stakes entry point for cautious buyers. A management consultant charging $20,000 for a strategy engagement might add a $1,500 half-day diagnostic that lets a nervous Early Majority buyer test the relationship before committing to the full scope. A SaaS product with a 14-day trial might extend it to 30 days for a vertical where buying cycles run longer. This isn’t discounting, it’s reducing the felt risk of the first step enough that people actually take it.
Now, the channel question. This is where operators lose the most money. Early Adopters are reachable through LinkedIn communities, niche newsletters, specific Slack groups, and personal intros from people they respect. Early Majority buyers don’t hang out in the same places. They read industry association publications. They ask peers in their own vertical for referrals. They trust case studies in outlets they already follow, not sponsored posts. This means the moment your customer base shifts, from a cluster of enthusiastic early buyers to a more pragmatic next wave, your channel mix needs to shift with it. You’re not running more of the same campaigns. You’re building a different distribution system.
On the chasm specifically: when early growth stalls and your existing customers are enthusiastic advocates, the most common culprit isn’t your product or your price. It’s that your Early Adopters are endorsing you into their own networks, which are full of other Early Adopters, while the Early Majority watches from the sideline waiting for different evidence. The fix is surgical. Identify three to five customers who look like the Early Majority you’re trying to reach, same industry, same headcount range, same geography if that matters, and invest in turning them into documented success stories with real numbers, not pull quotes. A staffing agency that replaced a generic testimonials page with four detailed stories from regional manufacturers saw their qualified lead rate from outbound nearly double over the following quarter, because the proof finally matched the audience.
Moore’s beachhead move, pick one narrow segment of the Early Majority, win it completely, then expand, is chronically underused by operators. When sales slow, the instinct is to broaden the pitch. That almost always makes things worse. A B2B software company selling to professional services firms might narrow to ‘accounting firms with 10 to 50 staff in the mid-Atlantic’ rather than ‘professional services generally.’ Counterintuitive, but a tighter niche means you build undeniable proof faster, your testimonials land more specifically, and you become the obvious option in that slice before anyone else does. Win that, then step to the adjacent vertical. The bowling-pin logic applies just as directly to local service businesses and professional practices as it does to SaaS.
Two things this model won’t tell you: exact timing, and which specific customers to call tomorrow. It maps the terrain. It doesn’t set the schedule or build your pipeline. Keep your expectations calibrated accordingly, and treat the percentages as rough archetypes rather than market-sizing inputs, your market is not a textbook normal distribution.
Used in
- ✓ Build a Complete Marketing Department
Used to structure the go-to-market sequencing for new offers, identifying which adopter segment to target first, what proof to build, and when to shift messaging from novelty to peer validation as the customer base matures. - ✓ The Missing Manual for FunnelKit
Applied when designing funnel flows for different audience segments, Early Adopter funnels emphasize potential and access, while Early Majority funnels lead with case studies, risk-reversal offers, and social proof sequenced to match how pragmatist buyers actually evaluate decisions. - ✓ The Missing Manual for Make
Informs how automation workflows are sequenced for lead nurturing, specifically, how to trigger different proof-based content (testimonials, case studies, demos) based on where a prospect sits on the adoption curve.
FAQ
What is diffusion of innovations in plain language?
It’s a framework, developed by Everett Rogers in his 1962 book of the same name, that describes how new ideas, products, and behaviors spread through a population over time. It sorts adopters into five groups, Innovators, Early Adopters, Early Majority, Late Majority, and Laggards, each with different motivations and risk tolerances, and each requiring a different marketing approach.
What are the five adopter categories and their approximate sizes?
Innovators (~2.5%), Early Adopters (~13.5%), Early Majority (~34%), Late Majority (~34%), and Laggards (~16%). These percentages are derived from a normal distribution applied to adoption timing and should be treated as rough archetypes, not precise market sizing tools.
How does Crossing the Chasm relate to diffusion of innovations?
Geoffrey Moore’s Crossing the Chasm (1991) built directly on Rogers’ model but added one critical claim: there is a dangerous gap, the chasm, between Early Adopters and the Early Majority, where most new products stall. Moore argued this happens because the two groups don’t share reference communities and buy for fundamentally different reasons. Rogers himself disputed the existence of a universal structural gap.
What are the five attributes that affect how fast an innovation spreads?
Relative Advantage (is it perceived as better than alternatives?), Compatibility (does it fit existing workflows and values?), Complexity (how hard is it to understand and use?), Trialability (can it be tested on a limited basis?), and Observability (can others see it being used and working?). Rogers reported that together these five explain between 49 and 87 percent of the variance in adoption rates across the studies he synthesized (Diffusion of Innovations, 5th ed., Free Press, 2003, p. 221).
Does diffusion of innovations apply to small businesses, or only to tech products?
It applies broadly, Rogers built the original model on agricultural and healthcare adoption data, not technology. Any small business introducing a new service model, entering a new market, or trying to grow beyond an enthusiastic early customer base can use the segmentation and five-attribute audit to diagnose where adoption is slowing and why.
What’s the most common reason a small business gets stuck after early success?
Usually the chasm dynamic: the business has won a cluster of Early Adopters whose enthusiasm generates referrals to other Early Adopters, but the larger Early Majority segment requires peer-validated proof from businesses like themselves, not endorsements from risk-tolerant early customers. The fix is building the right social proof for the right segment, not simply increasing marketing spend.
Further reading
- Everett M. Rogers, Diffusion of Innovations5th edition (Free Press, 2003)The primary source. Dense but authoritative; the five-attribute framework and adopter category profiles are set out in full here, grounded in decades of field research.
- Geoffrey A. Moore, Crossing the Chasm3rd edition (HarperBusiness, 2014)The practitioner’s application of Rogers’ model to high-tech markets. Most useful for operators with a genuinely discontinuous product facing the stall between early enthusiasm and mainstream adoption.
- Kapoor, K.K. Dwivedi, Y.K. and Williams, M.D. ‘Rogers’ Innovation Adoption Attributes: A Systematic Review and Synthesis of Existing Research,’ Information Systems Managementvol. 31, no. 1, pp. 74 to 91 (2014)The meta-analysis of 226 adoption studies (1996 to 2011) that identified relative advantage, compatibility, and complexity as the three attributes with the most consistent statistically significant relationships to adoption. DOI: 10.1080/10580530.2014.854103.
Sources:
Primary framework: Everett M. Rogers, Diffusion of Innovationsfirst published 1962 by Free Press of Glencoe; fifth edition published by Free Press (Simon & Schuster), 2003. The five adopter categories and approximate percentages (Innovators 2.5%, Early Adopters 13.5%, Early Majority 34%, Late Majority 34%, Laggards 16%) are drawn from Rogers’ model as set out in the fifth edition. The five innovation attributes (Relative Advantage, Compatibility, Complexity, Trialability, Observability) are described in Rogers (2003). The 49 to 87 percent variance range is reported by Rogers (2003, p. 221).
The claim that Diffusion of Innovations was the second most-cited book in the social sciences is sourced to multiple secondary accounts referencing the Social Science Citation Index, with consistent attribution to the mid-2000s. This article does not represent it as a current ranking, as no independently verified post-2010 citation-index comparison has been identified. Rogers’ role at Ohio State University at the time of the 1962 publication is confirmed by standard biographical sources.
The Kapoor, Dwivedi, and Williams meta-analysis: Kapoor, K.K. Dwivedi, Y.K. and Williams, M.D. ‘Rogers’ Innovation Adoption Attributes: A Systematic Review and Synthesis of Existing Research,’ Information Systems Managementvol. 31, no. 1, pp. 74 to 91, 2014. DOI: 10.1080/10580530.2014.854103. Confirmed via Aston University Research Explorer (research.aston.ac.uk) and King Fahd University of Petroleum & Minerals institutional repository (pure.kfupm.edu.sa). Note: Kapoor et al. also published a related paper in European Journal of Innovation Managementvol. 17, no. 3, pp. 327 to 348 (2014), DOI: 10.1108/EJIM-08-2012-0083; the citation above refers to the Information Systems Management paper specifically.
Geoffrey Moore, Crossing the Chasmfirst published 1991 by HarperBusiness; revised editions 1999 and 2014. Rogers’ disputed position on the chasm is noted in secondary sources. Slack and Dropbox adoption patterns described via secondary analysis consistent with public reporting. All section analysis, operator application, diagnostic frameworks, and business examples are original synthesis by The Operator’s Canon. The Singhal and Quinlan chapter citation from the previous version of this article has been removed pending verification of the precise chapter title and edition year of the Stacks and Salwen volume; the citation standing claim is now attributed to multiple secondary sources consistent with the mid-2000s timeframe only.
Brian Kasday spent forty years in direct-response marketing before rebuilding the whole operation as a one-person shop. He writes The Operator’s Library — including “Build a Complete Marketing Department” — for operators who’d rather build it themselves than wait on someone else.
Build the department these ideas describe. The free companion kit: mmsvegas.com/resources.
More The Operator's Canon guides
Free · Operator Toolkit
Want the tools, not just the guide?
Get the free operator toolkit — templates and checklists for the systems you actually run, plus a note when this guide changes.
Get the free toolkit →