
Last updated: October 2026
Leaky bucket marketing is the idea that every business operates like a bucket of water: acquisition pours customers in from the top, and churn lets them drain out the bottom. By the end of this page, you’ll be able to measure your own leak rate, translate it into dollars, and decide whether your next marketing dollar should go toward filling the bucket or patching the holes. For most small operators, that’s the most important budget call they’ll make this year.
What makes this model worth more than most diagrams in a marketing textbook is that it forces a sequence. Before you ask ‘how do I get more customers,’ it makes you ask ‘how many am I keeping?’ Those are very different questions, and they lead to very different answers about where to spend your time and money. Most operators skip the second question entirely, because acquisition feels like forward momentum and retention feels like maintenance. That instinct costs them.
A business growing its customer count while quietly churning through its existing base is running on a treadmill. The pace looks impressive; the position doesn’t change. The leaky bucket model makes the treadmill visible.
The idea in 30 seconds
- Every business leaks customers. The leaky bucket model asks whether you’re losing them faster than you’re winning them, and what that costs you.
- Plugging leaks is almost always cheaper than filling the bucket faster, because acquisition costs exceed retention costs in most business models.
- Churn compounds: small monthly losses erase a surprisingly large share of your base by year-end.
- The model gives you a diagnostic question to ask before any marketing spend: is the bucket structurally sound, or are you pouring into a sieve?
- Retention and acquisition are not either/or, but most small operators underinvest in retention relative to where the math actually points.
Where the Idea Came From
The phrase ‘leaky bucket’ in a marketing context is widely attributed to Andrew Ehrenberg, a German-born statistician and marketing scientist whose research shaped the empirical study of buyer behavior from the 1950s until his death in 2010. The standard secondary attribution traces the phrase to Ehrenberg’s Repeat-Buying: Facts, Theory and Applicationspublished in a second edition in 1988 by Charles Griffin (London) and Oxford University Press (New York), a citation that appears consistently across the academic literature. That attribution rests on secondary scholarly consensus rather than a verified page-and-line citation confirmed here.
Ehrenberg’s own position was considerably more nuanced than the popular ‘plug your leaks’ reading. His concern was specific to mass consumer goods, where apparent defectors often cycle back at lower frequency, and he used the phrase to name a syndrome he thought managers were misdiagnosing, mistaking normal purchase-cycle gaps for permanent defection, then over-medicating with acquisition spend. His position shifted somewhat by 1997. In ‘Advertising: Strongly Persuasive or Nudging?’ co-authored with Neil Barnard in the Journal of Advertising Research (January, February 1997), Ehrenberg acknowledged ‘a somewhat leaky bucket’ in which real erosion does occur over time and some recruitment of new buyers is therefore necessary. Still not an endorsement of heavy retention investment, more an acknowledgment that the bucket leaks a little and some top-up is always needed.
The economic case for aggressively plugging the leak was built by Frederick Reichheld and W. Earl Sasser in ‘Zero Defections: Quality Comes to Services,’ published in Harvard Business ReviewVol. 68, No. 5 (September, October 1990), pp. 105 to 111. Their central argument was that service companies should treat defecting customers the way manufacturers treat scrap: as evidence of a quality problem worth fixing at the source. They introduced ‘zero defections’ as an organizing goal and reported profit figures from specific named companies, an 85% profit lift in one bank’s branch system, 50% in an insurance brokerage, 30% in an auto-service chain, and a 125% rise at MBNA America after it halved its defection rate. These were case-study measurements from named companies, not a controlled trial. Peter Carroll disputed the methodology in ‘The Fallacy of Customer Retention,’ Journal of Retail BankingVol. 13, No. 4 (Winter 1991/1992), pp. 15 to 20, arguing the calculations were cross-sectional rather than longitudinal. Reichheld responded in the same issue. The directional pattern, that retention improvements have outsized profit effects in service businesses, is consistent with the underlying economics. The specific multipliers are not constants you can apply without doing your own numbers.
The honest synthesis: Ehrenberg named the bucket and, for most of his career, argued the leak was being overstated, particularly for mass consumer goods. Reichheld and Sasser built the economic case for plugging it aggressively, using service-sector data. Both contributed something true. Which one applies to your business depends on whether you’re running a subscription service firm or a mass-market consumer goods brand. For most operators reading this, it’s closer to Reichheld’s world than Ehrenberg’s.
How the Leaky Bucket Model Actually Works
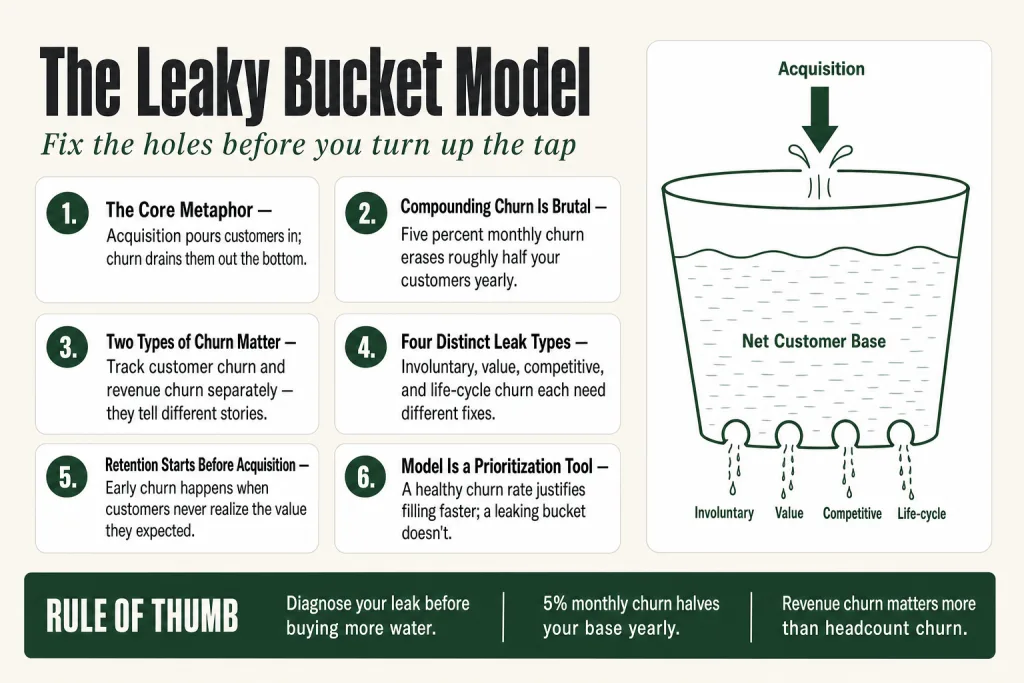
The mechanics are straightforward, which is both the model’s strength and its danger. In the analogy, water going into the bucket represents new customers being acquired and water flowing out represents customers lost to the firm, while the amount of water in the bucket represents the total customer base at any point in time.
This is a dynamic situation: there is a constant flow of new customers and a consistent loss of existing customers, so the total customer base constantly varies, sometimes growing, sometimes shrinking, depending on the inflow and the number and size of the holes.
The model gives you two levers. The firm can increase the water flow into the bucket, acquiring more new customers, or it can reduce or plug some of the holes, concentrating on retention. Most operators instinctively reach for the first lever. The model exists to make you think harder before you do.
The math that makes this concrete is churn rate and what it does to your base over time. Customer churn rate is the percentage of customers who stop doing business with you over a given period, measured annually, monthly, or at whatever cadence fits your business. Monthly churn is where operators often get surprised, because the compounding is brutal. Five percent monthly churn erases roughly half your customers in twelve months. A business that feels like it’s growing because it’s signing new contracts may be treading water or shrinking in terms of active relationships.
Churn is closely related to average customer lifetime. An annual churn rate of 25% implies an average customer life of four years; an annual churn rate of 33% implies an average customer life of three years. That relationship between churn rate and customer lifetime is the bridge to customer lifetime value: a high churn rate doesn’t just mean you lose people, it means every customer is worth less because the relationship ends sooner.
There’s also the distinction between customer churn and revenue churn, and operators who ignore it can draw badly wrong conclusions. A company losing two customers who paid $50 per month shows a higher customer churn count than a company losing one customer who paid $1,000 per month, but the second company’s revenue churn is higher. For most small businesses, tracking both is worth the effort. Losing your three smallest accounts is not the same problem as losing your single largest one, even if the customer count is identical.
The full cost of a churned customer is also often underestimated. Besides the direct loss of revenue, the cost of initially acquiring that customer may not yet have been covered by their spending to date, meaning the acquisition was a losing investment. When you factor in unrealized future revenue plus the cost to replace the account, the true loss per churned customer is typically much larger than it appears in the month they leave.
What Ignoring the Leak Actually Costs You
The economic argument for taking retention seriously comes down to one structural reality: a new customer has to be found, persuaded, and converted, three expensive steps, each with its own drop-off, while an existing customer has already cleared all three hurdles. The only job left is to not waste what you built.
The widely cited figure that acquisition costs more than retention traces back to a source worth naming precisely. Amy Gallo’s Harvard Business Review piece, ‘The Value of Keeping the Right Customers’ (October 2014), synthesizes decades of loyalty research and notes that acquiring a new customer can cost between five and twenty-five times more than retaining an existing one, depending on sector and channel mix. That range is wide for a reason, the multiplier depends heavily on your industry, your sales cycle, and how you count acquisition spend. Use it as a planning assumption, not a precision figure.
The Reichheld and Sasser 1990 research reported industry-specific profit lifts from retention improvements in named service businesses. The mechanism is intuitive: retained customers generate revenue without requiring a fresh acquisition spend, their transaction frequency often grows over time, and their referrals can bring in new customers at no incremental cost. As noted in the history section, Carroll (Winter 1991/1992) disputed some of the underlying calculations. The directional finding is credible; the specific multipliers should be treated as illustrative case measurements, not universal constants.
The compounding problem is what makes a leaky bucket especially dangerous for a small operator. A large business can absorb moderate churn because the volume of new customers flowing through is substantial. A small business with 200 active clients and a 20% annual churn rate is losing 40 clients per year. To grow by even 10% net, it needs to bring in 60 new clients, just to net 20. That’s not a growth strategy. That’s a replacement treadmill, and it gets more expensive every year as customer acquisition costs rise.
Diagnosing Your Leaky Bucket: The Operator’s Process
Before you can patch anything, you need to know how fast the water is leaving and where the holes are. Here’s how to actually do this for a small business, not a Fortune 500 retention team.
Step 1: Calculate Your Churn Rate
The formula is simple. Take the number of customers you lost in a period and divide by the number you had at the start of that period, then multiply by 100. Churn Rate = (Customers Lost During Period ÷ Customers at Start of Period) × 100. Do this for the last 12 months, then break it down by quarter to see if it’s improving or worsening. If you don’t have clean records of customer starts and stops, that is itself a signal, you can’t manage what you haven’t been tracking.
Step 2: Translate Churn Into Dollars
Customer count is a start; revenue impact is what gets attention. For each churned customer, the cost isn’t just the lost monthly or annual revenue, it’s the lost future revenue plus the acquisition cost you’ve now written off. One practical approach: take the expected customer lifetime value per churned customer and add the original acquisition cost. If a customer had an expected CLV of $X and you spent $Y to acquire them, a churn today costs roughly $X + $Y in lost future value and wasted acquisition spend. (This formula is a teaching construct derived from standard CLV math, not drawn from a specific study.) Run it for your average churned customer, then multiply by how many you lost last year. That number tends to focus the mind.
Step 3: Distinguish the Holes
Not all churn is equal, and not all of it is fixable. There are at least four distinct types worth separating:
- Involuntary churnthe customer didn’t want to leave; a failed payment, an expired card, or a billing error ended the relationship. This is often the easiest leak to plug. A dunning sequence or proactive card-update request can recover a meaningful portion of these.
- Value churnthe customer left because they stopped perceiving sufficient value. This points directly at your product, service, or onboarding. If it’s concentrated in the first 90 days, the problem is likely activation, not the ongoing relationship.
- Competitive churna competitor offered something better, cheaper, or more convenient. Sometimes this is a pricing problem; more often it’s a positioning problem. Are you the obvious choice for a specific customer type, or are you a generic option that’s easy to replace?
- Life-cycle churnthe customer’s situation changed and they genuinely no longer need what you sell. A wedding photographer loses clients when the wedding is over. A pediatric dentist loses them when the child grows up. This kind of churn is largely unavoidable; managing it means having a clear picture of average customer tenure so you’re not surprised by it.
Knowing which type dominates your churn profile changes everything about the intervention. Treating value churn with a winback discount campaign is the wrong tool. Treating competitive churn with better onboarding is equally wrong. Diagnosis comes before solution.
Step 4: Segment by Revenue, Not Just Count
Once you have your overall churn rate, cut it by customer segment. In almost every service business, a small number of accounts represent a disproportionate share of revenue. Focus your retention attention where the revenue concentration is, not where the headcount is.
Step 5: Set a Baseline and a Target
Directional reference ranges from SMB and SaaS industry analyses suggest that most established small service businesses run annual customer churn below 10%, while early-stage businesses tend to run higher as they find product-market fit. These are rough orientation points. Use them to understand whether you’re in a normal range or facing a structural problem, the direction of your trend over time matters as much as the absolute number.
Putting this to work? The ideas in the Canon are the foundation under the tactical playbook in Build a Complete Marketing Department. Grab the free companion kit at mmsvegas.com/resources.
Plugging the Leaks: What Actually Works for Operators
The theory says retention is cheaper and more profitable than acquisition. The practice is that most small operators don’t have a retention system, they have a retention habit, which is different. A habit is informal, inconsistent, and invisible. A system runs whether or not you’re paying close attention that week.
The First 90 Days
Early churn is the most preventable kind. Customers who leave in the first 90 days almost always leave because they didn’t successfully connect your product or service to the outcome they expected. The transaction happened; the value realization didn’t. The principle is well-documented: customers who don’t engage early don’t stay. Your onboarding, your first follow-up call, your first 30-day check-in, these aren’t niceties. They’re your best retention lever.
For a service business, this often means having a defined moment in the first 30 days where you confirm with the customer that they’ve seen the result they expected, not assumed it, confirmed it. If they haven’t, you find out while you can still fix it rather than when they’ve already decided to leave.
Proactive Communication Beats Reactive Winbacks
Most retention spending in small businesses happens after the customer has already decided to leave, a discount offer, a winback email, a ‘we miss you’ campaign. These have their place, but they’re expensive and their conversion rate is low. The more efficient investment is the communication that happens before the customer reaches a decision point.
This means having a simple calendar of touches that doesn’t depend on the customer initiating contact. Quarterly check-ins for service clients. Post-purchase follow-up for product customers. Usage-based outreach for subscription customers whose activity has dropped. The trigger for reaching out is the customer’s behavior or timeline, not a complaint. Reichheld and Sasser noted in their 1990 article that defection rates are also a guide for improving service quality, because listening to the reasons customers defect tells managers exactly where the company is falling short. The same logic applies before defection: the behavioral signals that precede departure are often visible if you’re watching.
Involuntary Churn Is Low-Hanging Fruit
A lot of operators find, when they actually look, that a meaningful portion of their customer losses are involuntary, failed payments, expired cards, billing system errors. For subscription and retainer-based service businesses, an accounts receivable process that catches lapsed payments before they become cancellations is often the cheapest fix in the whole retention toolkit. This is a systems problem, not a relationship problem.
Understand Why They Left, Then Stop Guessing
For a small operator, this means having a real exit conversation when a customer ends the relationship. Not a form that gets filed and forgotten, an actual question answered by a human: ‘What would have needed to be different?’ You’ll learn more from 10 honest exit conversations than from most retention analytics dashboards, and you’ll often find that the same two or three issues are driving the majority of your departures.
Negative Churn: The Retention Ceiling
The best version of a retention strategy isn’t zero churn, it’s negative revenue churn, where the revenue expansion from existing customers more than offsets the revenue lost from those who leave. For a service business, this means having a natural path from a smaller engagement to a larger one. It doesn’t require a complex upsell engine. It requires knowing which of your existing customers has a problem your other services solve, and having a process for making that connection.
Leaky Bucket Marketing vs. Pirate Metrics: Where They Agree and Where They Don’t
AARRR is an acronym for the five stages of the startup metrics funnel: Acquisition, Activation, Retention, Referral, Revenue, coined by Dave McClure of 500 Startups in a 2007 presentation. Both frameworks use the leaky bucket metaphor and both treat retention as critical. But they’re organized around different questions, and confusing them leads to mis-prioritization.
AARRR is a funnel diagnostic. It helps you find the stage where the most value is being lost across the entire customer journey, from first touch to revenue. A startup acquiring 10,000 users monthly might look healthy, but if only 5% ever experience core value (activation), retention is 10%, and referral is near zero, they are burning cash to fill a leaky bucket, and AARRR makes this visible. The framework treats each stage as a potential bottleneck and asks you to fix the biggest one first.
The leaky bucket model is narrower and more operational. It focuses specifically on the stock of customers you already have, measuring the rate of loss, the cost of that loss, and the economics of plugging versus filling. Where AARRR says ‘find the leak in the funnel,’ the leaky bucket says ‘measure the net level in the tank and decide whether your acquisition budget is working for or against you.’
The contrast is sharpest in what each model says to prioritize. AARRR, as originally sequenced by McClure, starts with Acquisition. In 2017, Thomas Petit and Gabor Papp proposed reordering it as RARRA, Retention, Activation, Referral, Revenue, Acquisition, arguing that as acquisition costs spiked, building on a leaky retention base was strategically backward. That reordering is closer to what the leaky bucket model has always implied: before you spend on acquisition, confirm you have a structure worth filling.
For a small operator, the practical synthesis is this: use AARRR to find where in the customer journey you’re losing value. Use the leaky bucket model to make the go/no-go decision on acquisition spend, if your current churn rate means you’ll lose most of what you acquire within 12 months, fix the retention problem first. If your churn rate is healthy but growth is slow, your leak is sealed enough to justify filling faster.
Where Leaky Bucket Marketing Works, and Where It Misleads
The model is most useful for businesses with recurring revenue, repeat purchase patterns, or ongoing service relationships. Subscription services, professional service firms on retainer, software companies, gyms, insurance agencies, maintenance contracts, restaurants with loyalty programs, any business where the same customer can generate revenue multiple times benefits from the retention lens the model provides.
It’s less clean for transaction businesses where the customer relationship is inherently episodic. A real estate agent, a wedding photographer, a general contractor, these businesses have high single-transaction value and naturally low repeat rates that look like churn but aren’t. The leaky bucket model can create false urgency in these contexts: if your customer lifecycle is genuinely single-event, a low ‘retention rate’ is expected, not a crisis. The relevant retention question for these businesses is referral rate and reputation, not repeat purchase rate.
The academic pushback on the model, rooted in the research tradition Ehrenberg himself established, points out that for mass consumer goods brands, acquisition may be the dominant growth lever and normal defection rates may be structurally unavoidable. Secondary analyses in that tradition show that brand growth depends largely on a company’s ability to outperform similar-sized rivals in acquisition, and that all brands tend to experience close to expected rates of defection whether they are growing or declining. This is a genuine tension, not a debate to dismiss.
For a local service business or B2B firm with 50 to 500 clients, the dynamics are completely different from a mass consumer brand: each relationship has meaningful individual value, switching costs are real, and the operator has enough proximity to the customer to actually intervene before they leave. The leaky bucket model was built for that second context, and that’s where operators should apply it.
The other place it misleads is when operators use it to justify never investing in acquisition. The bucket needs both, inflow and retention. A business that has plugged every leak but stopped acquiring new customers is dying slowly by natural attrition. The model is a diagnostic tool and a prioritization aid, not a mandate to stop filling the bucket.
Conceptual Misunderstandings About the Leaky Bucket Model
These are errors in how people understand the model, the wrong mental map, before anyone tries to apply it. Application mistakes are in the Common Mistakes section below.
Misunderstanding 1: Ehrenberg’s model says retention doesn’t matter. This is the most common misread of his work. Ehrenberg’s argument was specifically about consumer packaged goods, where purchase-cycle gaps look like defection but often aren’t, the same buyer cycling back at lower frequency. His warning was against panic-spending on replacement acquisition because of misread data, not against retention as a discipline. By 1997, writing with Neil Barnard in the Journal of Advertising Researchhe was acknowledging ‘a somewhat leaky bucket’ that does require some buyer recruitment to offset. The nuance got lost in the popular retelling.
Misunderstanding 2: The model applies equally to all business types. It doesn’t. The leaky bucket frame assumes customers can repurchase and that repeat relationships generate compounding value. Where the customer lifecycle is genuinely single-transaction, a conveyancing solicitor, a funeral director, a general contractor, the model’s core premise breaks down. Applying it there generates false urgency around a ‘low retention rate’ that isn’t actually a problem.
Misunderstanding 3: Zero churn is the goal. Zero churn isn’t realistic, and in some cases isn’t desirable. Customers who have stopped getting value but haven’t yet left can generate disproportionate support costs, distorted feedback, and pricing drag. Holding them indefinitely isn’t loyalty; it’s inertia. The target is a healthy retention rate for your business model, one that allows sustainable growth without demanding runaway acquisition spend to offset losses.
Misunderstanding 4: Low customer churn always means a healthy business. A business can have near-zero customer churn and still face declining revenue if customers are spending less over time. Revenue churn, and expansion revenue, tell a different story from customer count. You can hold every customer and still watch revenue shrink if you’re not managing the value of each relationship, not just its existence.
Misunderstanding 5: The Reichheld and Sasser profit figures are universal constants. The profit-lift figures from their 1990 article come from specific case studies of specific service companies. Carroll (Winter 1991/1992), writing in the Journal of Retail Bankingdisputed the methodology as cross-sectional rather than longitudinal. The directional finding, that retention improvements have outsized profit effects in service businesses, is consistent with the economics. The specific multipliers are not laws you can apply to your business without doing your own numbers.
Common Mistakes
- Tracking customer churn count but not revenue churn. Set up two separate churn calculations: one for customer count, one for revenue. Run them monthly. When they diverge, customer count churn is low but revenue churn is rising, you’re losing your highest-value accounts disproportionately. That’s the signal to audit your relationship with your top 10 accounts before they leave, not after.
- Spending retention budget on winback campaigns instead of early-warning systems. Move the budget upstream. Set a behavioral trigger, say, no login in 14 days for a SaaS product, or no reorder in 60 days for a product business, and route those customers to a human check-in before they’ve made a leaving decision. A five-minute proactive call converts at a far higher rate than a ‘we miss you’ email sent after the account has already churned.
- Treating retention as a customer service function rather than a marketing one. Retention starts in the marketing decisions you make before the customer ever signs: who you target, how you position your offer, what expectations you set in ads and sales conversations. Assign someone in marketing ownership of a retention metric, 90-day retention rate is a clean one, and tie campaign performance to it, not just leads generated.
- Using industry average churn benchmarks as a goal rather than a floor. Calculate the dollar value of your current churn rate, even if the rate itself looks ‘normal’ for your sector. A 10% annual churn rate on a $500,000 revenue base is $50,000 walking out the door each year. Ask whether that $50,000 would produce a better return invested in retention rather than in the acquisition campaigns you’re currently running alongside it.
- Assuming better onboarding will fix all churn. Onboarding addresses value churn in the first 90 days. It does almost nothing for competitive churn (a better offer arrived), involuntary churn (a payment failed), or life-cycle churn (the customer’s situation changed). Before spending on any retention fix, identify which of these four churn types is actually dominant in your business. The wrong fix costs as much as no fix.
Operator’s Take
Do the math you’ve been avoiding. Take your annual churn rate, multiply it by your average customer revenue, and write that number down. A 15% churn rate on a $400,000 revenue base is $60,000 walking out the door before you’ve earned a cent of growth. Now ask what you spent on retention last year, on anything that might have kept those customers from leaving. Most operators already know the answer, and it’s uncomfortable.
Start with involuntary churn. Pull your payment failure data if you run any kind of subscription or retainer. In my experience, somewhere between 10 and 20 percent of total losses are customers who didn’t intend to leave, a card expired, a payment bounced, nobody followed up. That’s fixable in a week with a dunning email sequence and a card-update prompt. Do this before you touch anything else, because you’re recovering accounts you’ve already written off mentally, at almost no cost.
Then look specifically at your first-90-day loss rate. Segment out clients who churned before day 90 and figure out what they had in common, service type, the channel they came from, contract size, who onboarded them. Almost every time, it’s a failure of activation: they didn’t get to the outcome they expected fast enough, or nobody confirmed with them that they had. A structured check-in call at day 14 and day 30 will catch more problems than most automated nurture sequences. The difference is that a human call gets answered and creates a two-way conversation. An automated email gets filtered.
Talk to the people who left. Not a survey, not a cancel-flow question they click through to get rid of the modal. A real message from a real person asking what would have needed to be different. Ten of those conversations will reorder your entire understanding of your retention problem. You’ll find that two or three things are responsible for the majority of your exits, and at least one of them will surprise you.
Here’s where the model trips operators up, though. Setting up a check-in calendar or a nurture sequence feels like solving the retention problem. It isn’t. Those are tactics. The structural fix is upstream, in who you’re acquiring. If you’re bringing in clients who were never a strong fit for what you actually deliver, they’ll churn on schedule no matter how good your onboarding is. The best retention investment is often tighter positioning, deciding clearly who you’re for, so the customer relationship starts with aligned expectations. Bad fit isn’t a retention problem. It’s an acquisition problem that shows up late.
On acquisition spend: the leaky bucket model is a prioritization tool, not a moratorium on growth. The question isn’t ‘should I acquire new customers.’ It’s ‘what churn rate makes my acquisition spend worthwhile?’ If your average customer stays 14 months and your average acquisition cost is $800, you need a certain minimum revenue rate just to break even on the acquisition before you’ve earned a cent of profit. Run that number. It changes how you evaluate every campaign proposal you’ll see this year.
One place AI tools have actually earned their keep in retention: surfacing behavioral signals before a customer reaches a cancellation decision. Dropped logins, reduced order frequency, slower email response times, an AI-assisted workflow can flag those patterns and route them to a human check-in at the right moment. The judgment call on what to do next is yours. But an early-warning layer that doesn’t depend on you remembering to check is within reach for most operators now, not just enterprise teams with dedicated customer success headcount. It protects the relationship you already have.
Used in
- ✓ Build a Complete Marketing Department
Used as the diagnostic frame for deciding how to split marketing budget between acquisition and retention, the leaky bucket calculation determines whether new campaign spend is justified before addressing customer loss. - ✓ The Missing Manual for FunnelKit
Applied when building post-purchase automation sequences, the model defines which trigger points (day 7, day 30, day 60) require an active retention touchpoint to prevent early-stage churn. - ✓ The Missing Manual for Make
Used to design automated churn-detection workflows, flagging customers who have gone quiet, routing them to re-engagement sequences, and surfacing involuntary-churn cases to a billing recovery flow.
FAQ
What is leaky bucket marketing in simple terms?
It’s a model that compares your customer base to a bucket of water. Acquisition pours customers in from the top; churn lets them drain out the bottom. The model forces you to ask whether you’re losing customers faster than you’re winning them, and what that costs before you spend more on acquisition.
Who created the leaky bucket model?
The phrase is widely attributed to Andrew Ehrenberg, a German-born statistician and marketing scientist, with multiple independent academic sources citing his book Repeat-Buying: Facts, Theory and Applications (Charles Griffin and Oxford University Press, 1988). That attribution reflects secondary scholarly consensus rather than a verified page-and-line citation to the primary text. Importantly, Ehrenberg used the phrase to name a syndrome he thought managers were misdiagnosing, not to endorse aggressive retention spending. The economic case for aggressively plugging the leak was built by Frederick Reichheld and W. Earl Sasser in ‘Zero Defections: Quality Comes to Services,’ Harvard Business Review, Vol. 68, No. 5 (September, October 1990), pp. 105 to 111.
How do I calculate my churn rate?
Divide the number of customers you lost in a period by the number you had at the start of that period, then multiply by 100. Do this for at least 12 months, broken into quarters, to see whether it’s improving or worsening. Then calculate revenue churn separately to understand the dollar impact.
Is it always better to focus on retention over acquisition?
Not always. Retention is typically more cost-efficient than acquisition, and fixing a badly leaking bucket before spending more on acquisition is sound logic. But a business that stops acquiring customers entirely will shrink by natural attrition. The model is a prioritization tool, not a mandate to abandon acquisition.
What is a good churn rate for a small business?
It depends heavily on industry and business model. Directional benchmarks from industry analyses suggest most established small service businesses aim for annual customer churn below 10%, while early-stage businesses tend to run higher. Track your own trend over time and compare to sector-specific benchmarks for your business type, the direction matters as much as the absolute number.
How does the leaky bucket model relate to customer lifetime value?
Directly. Churn rate determines how long the average customer relationship lasts, which is one of the core inputs to customer lifetime value. A higher churn rate shortens average customer tenure, which shrinks CLV. Plugging the bucket extends tenure and makes each customer worth more, without changing price or transaction frequency.
Further reading
- Ehrenberg, A.S.C. Repeat-Buying: Facts, Theory and Applications (2nd ed. Charles Griffin and Oxford University Press, 1988)The source most consistently cited for the original ‘leaky bucket’ phrase, confirmed across multiple academic sources. The specific phrase attribution rests on secondary scholarly consensus rather than a verified primary-source page reference confirmed here. Note: the same 1988 text also appears under a Hodder Arnold ISBN (0852642873) in some bookseller records; WorldCat (OCLC 22542127) and the Internet Archive both confirm the Griffin/Oxford University Press imprint.
- Barnard, N. and Ehrenberg, A.S.C. ‘Advertising: Strongly Persuasive or Nudging?’ Journal of Advertising ResearchJanuary, February 1997Contains Ehrenberg’s own later, somewhat revised use of the ‘leaky bucket’ phrase, acknowledging real erosion and the need for some buyer recruitment to offset it.
- Reichheld, F. and Sasser, W.E. ‘Zero Defections: Quality Comes to Services,’ Harvard Business ReviewVol. 68, No. 5 (September, October 1990), pp. 105 to 111The article that built the economic case for retention investment, with industry-specific profit-impact data from named banking, insurance, and auto-service businesses.
- Carroll, P. ‘The Fallacy of Customer Retention,’ Journal of Retail BankingVol. 13, No. 4 (Winter 1991/1992), pp. 15 to 20The methodological challenge to Reichheld and Sasser’s profit figures; argues the original analysis was cross-sectional rather than longitudinal. Reichheld responded in the same issue.
- Reichheld, F.F. The Loyalty Effect (Harvard Business School Press, 1996)Expands the retention economics argument into a full business framework; useful for operators who want to build a systematic loyalty program rather than just reduce churn.
Sources:
Attribution for the leaky bucket phrase to Ehrenberg (1988) appears consistently across the academic secondary literature, including Jim Blythe’s entry in Key Concepts in Marketing (SAGE, doi.org/10.4135/9781446221617.n5) and multiple peer-reviewed citations. The 1988 edition of Repeat-Buying was published by Charles Griffin (London) and Oxford University Press (New York), confirmed via WorldCat (OCLC 22542127), the Internet Archive, and citation records in the Journal of Marketing. The same text appears under a Hodder Arnold ISBN (0852642873) in some bookseller records; these reflect a different ISBN rather than a different publisher, the copyright page, reproduced at empgens.com, confirms Charles Griffin as publisher. That attribution has not been verified here against the primary text and is presented as scholarly consensus. Ehrenberg’s 1997 use of the phrase appears in Barnard and Ehrenberg, ‘Advertising: Strongly Persuasive or Nudging?’, Journal of Advertising ResearchJanuary, February 1997, confirmed via the WARC full-text archive. The Reichheld and Sasser 1990 figures are sourced from the published article (Harvard Business ReviewVol. 68, No. 5, pp. 105 to 111), confirmed via the Harvard Business School faculty page (hbs.edu) and the Bain reprint page (bain.com). The Carroll (Winter 1991/1992) methodological dispute, ‘The Fallacy of Customer Retention,’ Journal of Retail BankingVol. 13, No. 4, pp. 15 to 20, is confirmed via Gale Academic OneFile (Document Number GALE|A11815449) and a Springer chapter bibliography; Reichheld’s response in the same issue is also confirmed in that Springer bibliography. The AARRR origin date and McClure attribution are confirmed across multiple consistent secondary sources dating the 2007 SeedCamp presentation. RARRA reordering attributed to Thomas Petit and Gabor Papp (2017), confirmed at phiture.com and across multiple consistent secondary sources. Churn benchmark figures are treated as directional reference ranges drawn from industry analyses and are not presented as precision statistics from a named study. The widely circulated ‘5% retention = 25 to 95% profit’ figure is not from the 1990 Reichheld and Sasser article; its sourcing is discussed at beyaoshy.com, which traces the range to the July 2000 HBR article by Reichheld and Schefter on e-loyalty, not the 1990 piece. Amy Gallo’s acquisition-cost multiplier range (‘The Value of Keeping the Right Customers,’ Harvard Business ReviewOctober 2014) is presented as a planning assumption with the sector-dependence caveat intact.
Brian Kasday spent forty years in direct-response marketing before rebuilding the whole operation as a one-person shop. He writes The Operator’s Library — including “Build a Complete Marketing Department” — for operators who’d rather build it themselves than wait on someone else.
Build the department these ideas describe. The free companion kit: mmsvegas.com/resources.
More The Operator's Canon guides
Free · Operator Toolkit
Want the tools, not just the guide?
Get the free operator toolkit — templates and checklists for the systems you actually run, plus a note when this guide changes.
Get the free toolkit →