
Last updated: November 2026
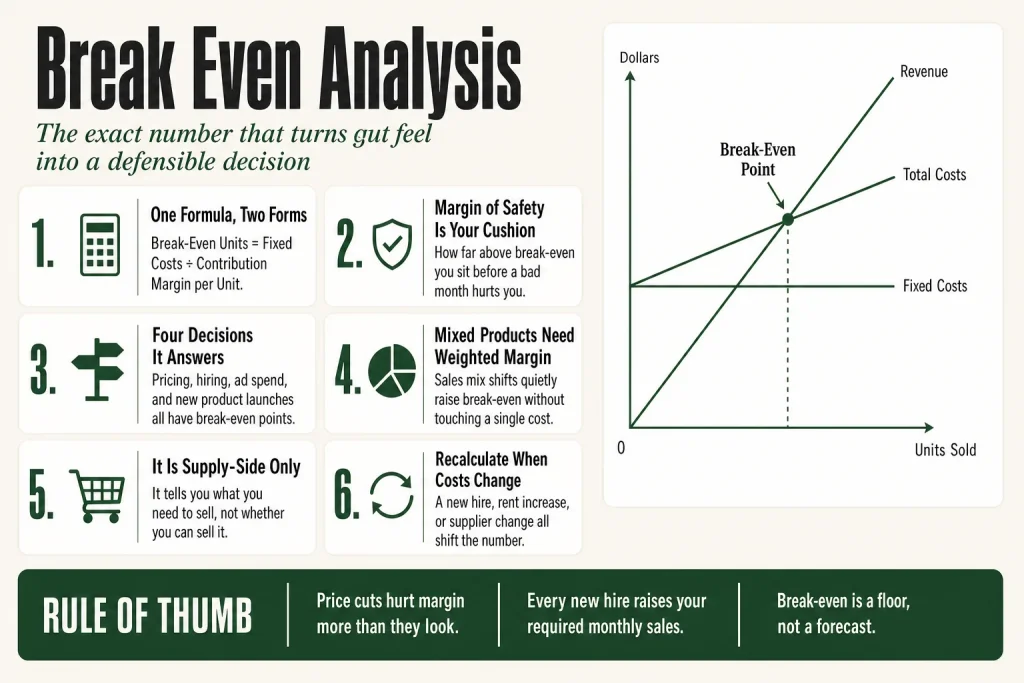
Break even analysis is the calculation that tells you the minimum volume, price, or margin required for a decision not to lose you money. By the end of this page, you’ll be able to run that calculation for the four decisions operators face most often, including pricing, hiring, ad spend, and new-product launches, and you’ll know exactly where the formula’s blind spots are so you don’t mistake a spreadsheet answer for a market answer.
Most operators make major decisions by feel. They hire someone because they’re overworked, run ads because a competitor is running them, and set prices because a competitor charges roughly that. Break even analysis replaces “I think this probably works” with “here is the exact number of sales, at this margin, where this decision stops bleeding and starts paying.” That shift from vague confidence to a specific target is worth more than most of the strategic frameworks you’ll read about.
The concept is genuinely old and genuinely simple. That’s not a knock on it. The operators who use it well are the ones who understand that simple done consistently beats sophisticated done once.
The idea in 30 seconds
- Break even analysis finds the exact sales volume, price, or margin at which revenue equals total costs and profit is zero.
- The core formula: Break-Even Units = Fixed Costs ÷ Contribution Margin per Unit, where Contribution Margin = Price minus Variable Cost per Unit.
- Every major operator decision, including hiring, advertising spend, price changes, and new product launches, has a break-even point you can calculate before committing.
- Margin of safety tells you how far above break-even you currently sit, which is your real cushion against a bad month.
- The analysis is supply-side only: it tells you what you need to sell, not whether you can actually sell it. Pair it with demand reality.
- Recalculate any time your cost structure changes. A new hire, a rent increase, or a supplier change all shift the number.
Where Break Even Analysis Came From
The phrase “break-even point” was coined by Walter Rautenstrauch, an engineer and professor at Columbia University, in his 1930 book The Successful Control of Profits (B. C. Forbes Publishing Company, New York). In it, he used the term to describe the relationships of cost, volume, price, and profit. That vocabulary is the contribution the book is remembered for.
The chart itself has an earlier origin. Henry Hess published what is generally taken to be the first graphical break-even chart in a 1903 article titled ‘Manufacturing: Capital, Cost, Profit and Dividends’ in Engineering Magazine (pp. 892 to 898), which he called a crossover chart. Charles Edward Knoeppel and Edgar Seybold set out the fixed and variable cost split in their 1918 book Graphic Production Controland into the 1960s some writers still called the chart a Knoeppel graph. Rautenstrauch’s contribution was the name that stuck.
Adoption spread fast in the early 1930s. Firms under the pressure of the Depression needed to know their minimum viable sales level, and a chart showing where revenue crossed total costs was not an abstraction. Post-war business schools folded it into the broader framework of cost-volume-profit (CVP) analysis, which is where it lives in most textbooks today. The operator’s version of this page is not especially interested in CVP as an academic framework. The question is: what does a small-business operator actually do with it?
The Core Mechanics of Break Even Analysis
There are two versions of the calculation, and you need both.
Break-Even in Units
This is where you start if your business sells a relatively consistent product or service package.
Step 1: Identify your fixed costs. These are the costs that do not change with your output: rent, salaried payroll, software subscriptions, insurance, loan payments. They hit whether you sell one unit or a thousand.
Step 2: Calculate your contribution margin per unit. This is the price you charge for one unit minus the variable costs tied directly to delivering that unit. Variable costs include raw materials, payment processing fees, shipping, commissions, and any labor that scales with production. If you sell a product for $120 and it costs you $45 to make and deliver each one, your contribution margin is $75.
Step 3: Divide fixed costs by the contribution margin per unit.
Break-Even Units = Fixed Costs ÷ Contribution Margin per Unit
If your monthly fixed costs are $9,000 and your contribution margin per unit is $75, you need to sell 120 units per month before you stop losing money. Not 119. Not “around 100.” One hundred and twenty.
Break-Even in Revenue Dollars
This version is more useful when your business sells multiple products or services at different price points, or when you think in revenue terms rather than unit terms.
Contribution Margin Ratio = Contribution Margin per Unit ÷ Selling Price
Break-Even Revenue = Fixed Costs ÷ Contribution Margin Ratio
Using the same example: $75 contribution margin ÷ $120 selling price = 62.5% contribution margin ratio. Break-even revenue = $9,000 ÷ 0.625 = $14,400 per month. That’s the revenue figure your marketing team, your sales team, and your own calendar need to hit before the business is profitable for the month.
Margin of Safety
Once you know your break-even, the next number to track is the margin of safety: how far above break-even you currently operate. If your current monthly revenue is $19,000 and your break-even is $14,400, your margin of safety is $4,600, or about 24%. That 24% is how much your revenue can fall before you’re losing money. A thin margin of safety is a flashing yellow light. A comfortable one gives you room to experiment.
Margin of Safety (%) = (Current Sales, Break-Even Sales) ÷ Current Sales × 100
Most operators never calculate this. They feel comfortable because revenue is up, without knowing how close to the edge they actually are when a slow month or an unexpected cost hits.
The Four Decisions Break Even Analysis Actually Answers
The textbook stops at the formula. Operators need to know where to aim it. Here are the four decisions where break even analysis does the most work.
1. Pricing Decisions
A price cut feels like a growth move. Break even analysis shows you whether you can afford it. The mechanics here are unforgiving: a price reduction comes straight out of contribution margin while variable costs hold flat, so a modest discount requires a disproportionately large volume increase just to stand still. If your current margin is 62.5% and a discount drops it to 50%, your break-even revenue on the same fixed cost base rises from $14,400 to $18,000. That’s a 25% jump in required sales just to stay flat. You need to believe the discount will drive at least that much additional volume before the promotion pays for itself.
The reverse also holds. A price increase, even a modest one, dramatically lowers break-even because you’re improving contribution margin without touching fixed costs. A business that charges $120 and moves to $135, while variable costs hold at $45, sees contribution margin jump from $75 to $90, a 20% improvement. Break-even falls from 120 units to 100. That’s 20 fewer units you need to sell every month to be profitable. Pricing decisions should always be run through a break-even lens first.
Note on the examples above: these are the author’s own illustrative calculations applying standard cost-volume-profit accounting mechanics. They are not drawn from an external study.
2. Hiring Decisions
A new hire is a new fixed cost. That’s the simple version. The slightly more complete version: the total cost of a new employee, including salary, payroll taxes, benefits, equipment, and onboarding time, is often meaningfully higher than the base salary alone. Add that fully loaded number to your monthly fixed costs and recalculate break-even.
If your fixed costs rise from $9,000 to $13,200 with a new hire, and your contribution margin per unit is still $75, your break-even climbs from 120 units to 176 units. The question the analysis actually asks is: do you have a credible path to selling 56 more units per month? Not “will things probably get busier?” but a specific, defended answer to a specific number.
For hires who generate revenue directly, a useful reframe, and this is the author’s own synthesis rather than standard accounting doctrine: how much new revenue does this person need to enable or produce at your contribution margin ratio just to cover their own cost? If a new salesperson adds $8,000 per month in fully loaded fixed cost and your contribution margin ratio is 40%, they need to drive $20,000 in new monthly revenue just to break even on their own salary. That becomes the minimum performance target, not a stretch goal. It is the floor.
3. Advertising Spend
Every ad campaign has a break-even CAC (customer acquisition cost). The calculation below is the author’s own application of the standard contribution margin formula to a paid acquisition context, not a separately published framework.
Break-Even CAC = Average Order Value, Variable Costs (including fulfillment, COGS, fees, excluding ad spend)
If you sell a product for $100 and your variable costs excluding ad spend are $48, your break-even CAC is $52. Spend more than that per acquired customer and each new customer is a loss, regardless of revenue. Spend less and each customer is incrementally profitable.
For campaigns measured by ROAS (return on ad spend), the break-even ROAS is calculated as 1 divided by your gross margin expressed as a decimal. This is standard paid-media math: at a 50% gross margin, break-even ROAS is 2.0x, meaning every dollar spent must return at least two in revenue. Your own margin, not an industry benchmark, is what your media buyer should be optimizing against.
Subscription businesses and businesses with meaningful repeat purchase rates can spend above break-even CAC on the first transaction if customer lifetime value justifies it, but that requires a separate and honest LTV calculation, not an optimistic one.
4. New Product or Location Launches
Before signing a lease, placing a large inventory order, or committing development time to a new product line, break even analysis converts a hopeful bet into a testable hypothesis. What are the fixed costs of this venture? What contribution margin does the new product or location generate? How many units or how much revenue does it require monthly to cover those costs? Can you honestly see a path to that number within a defined time frame?
A second location that requires $60,000 per month in revenue to break even, in a market you do not yet know, is a materially different decision than one that requires $20,000. The analysis does not tell you whether to open the location. It tells you what you’re betting and how large the bet is.
Putting this to work? The ideas in the Canon are the foundation under the tactical playbook in Build a Complete Marketing Department. Grab the free companion kit at mmsvegas.com/resources.
Handling Multiple Products: Weighted Contribution Margin
The single-product formula works cleanly for businesses with one main offer. Most small businesses sell a mix. A bakery sells loaves, croissants, and cakes. A marketing agency sells retainers, project work, and workshops. Each has a different price and a different variable cost, so each has a different contribution margin.
When your product mix is stable, use a weighted average contribution margin.
Weighted Average Contribution Margin = Σ (Contribution Margin per Product × % of Sales Mix)
Then plug that weighted margin into the standard formula. The important caveat: the break-even point you calculate only holds while that sales mix holds. If your highest-margin product gets outsold by your lowest-margin one, the break-even shifts upward without you touching a single cost. This is a real trap for operators who celebrate revenue growth without noticing that margin composition has quietly eroded. Track your mix, not just your top line.
Break Even Analysis in Subscription and Recurring Revenue Businesses
Recurring revenue changes the unit of analysis. For a SaaS product or a subscription service, you are not selling a one-time transaction. You are acquiring a customer who pays monthly. The relevant break-even question becomes: how many active subscribers do you need to cover your fixed costs? The formula below is the author’s own adaptation of the standard break-even calculation to a subscription context.
Break-Even Subscribers = Monthly Fixed Costs ÷ (Monthly Recurring Revenue per Subscriber, Variable Cost per Subscriber)
If your monthly fixed costs are $20,000 and each subscriber pays $49 per month with $6 in variable costs (hosting, support load, payment fees), your contribution margin per subscriber is $43. You need 466 active subscribers to break even on operating costs.
The complication is churn. A business with 466 subscribers and 5% monthly churn is losing roughly 23 subscribers per month. It needs to acquire 23 or more new subscribers monthly just to stay at break-even subscriber count, before accounting for growth. This is why break-even analysis for subscription businesses must be paired with a CAC payback period analysis. Acquiring subscribers cheaply enough that CAC pays back before average churn terminates the relationship is the foundational viability question for any subscription model.
Churn also means the break-even point is not static. It is a moving target. Every month you sit at exactly break-even subscriber count with any churn at all, you are sliding backward.
Where Break Even Analysis Works Best
Break even analysis is most reliable when your cost structure is reasonably stable and your contribution margin per unit is consistent. That covers a wide range of small-business situations: a service business with monthly retainer clients, a product business with stable COGS, a restaurant with a relatively fixed menu and cost structure, a software business with predictable hosting and support costs.
It is especially useful in these moments specifically:
- Before committing to any new fixed cost, whether a lease, a hire, or a piece of equipment.
- When evaluating whether a price change is worth it.
- When setting a minimum performance target for a new advertising channel.
- When deciding whether to add a product line or kill an underperforming one.
- When you want to know how much revenue your business can afford to lose before it stops being profitable, which is a useful number to have going into a slow season or a negotiation.
The analysis recalculates fast. Once you have your fixed costs and contribution margin in a simple spreadsheet, testing scenarios takes minutes. That speed is part of its value. You can answer “what if we run a 20% discount?” or “what if our material costs go up by 10%?” without a two-hour finance meeting.
Where Break Even Analysis Breaks Down
The analysis has real limits, and operators who ignore them end up with false confidence.
It tells you nothing about demand. Break even analysis is a supply-side calculation. It tells you what you need to sell. It has no opinion on whether you can sell it. A business that breaks even at 500 units per month and has never sold more than 300 has a math problem, not a planning problem. The break-even chart looks clean on the left side whether or not a customer has ever walked through the door.
It assumes linear costs and prices. The model treats fixed costs as truly fixed and variable costs as perfectly proportional to volume. In practice, neither is exactly true. Rent has step changes when you expand space. Bulk purchasing reduces per-unit variable costs at volume. Labor costs rise in chunks when you add shifts. At the operating scale of most small businesses, linear assumptions are good enough. Just be aware that large changes in volume can invalidate the model if your cost structure has step-changes built into it.
It ignores cash timing. Break even analysis uses accounting revenue, meaning revenue when it is earned. A business that break-even analysis declares profitable can still run out of cash if customers pay 60 days late and suppliers want payment in 30. Profitability and solvency are different things. Run a break-even analysis, then run a cash flow projection separately.
It treats all revenue as equally good. The formula does not care whether your sales are from high-lifetime-value customers or one-time buyers. It does not account for churn, refunds, or the cost of serving difficult customers. A business running at break-even on transaction margin and losing 30% of customers every six months is not actually at break-even when you account for the full cost of re-acquiring them.
Common Mistakes
- Using gross margin instead of contribution margin. Contribution margin subtracts only variable costs from price. Gross margin often includes fixed overhead allocated per unit, which inflates your apparent margin and understates break-even. Rebuild your cost list from scratch, separating every line into ‘changes with each unit sold’ (variable) or ‘stays the same regardless of volume’ (fixed). Use only the variable column in your contribution margin calculation.
- Anchoring your price to competitors without running the break-even math first. Competitor pricing tells you what the market will accept, not whether that price covers your cost structure. Your costs are not their costs. Before matching or undercutting a competitor, calculate what contribution margin that price produces against your specific fixed costs. If the resulting break-even volume exceeds your realistic sales capacity, the pricing decision fails regardless of what the market is doing.
- Treating the analysis as a green light rather than a floor. Break-even tells you the minimum required, not the expected outcome. Before acting on a favorable break-even number, explicitly stress-test demand: what is your current average monthly volume, what is the realistic upside, and does that upside actually clear the required threshold? If you cannot answer those questions with data, validate demand before you commit the cost.
- Ignoring the step-cost problem when volume changes significantly. The standard formula treats fixed costs as truly fixed across all volume levels. In practice, they step up: a second shift adds a supervisor, a new product line adds warehouse space, a major sales jump requires another customer service rep. If you are modeling a large volume increase, map out where those step-changes occur and build them into the calculation explicitly rather than assuming costs scale linearly.
- Ignoring the cash timing gap. Break-even uses accrual revenue, meaning revenue when it is earned, not when it is collected. A business that appears profitable on a break-even basis can still run out of cash if customers pay 60 days late and suppliers require payment in 30. After running your break-even, build a separate 13-week cash flow projection to confirm you can fund the gap between when costs are paid and when customers actually pay.
Operator’s Take
Break even analysis has a credibility problem it does not deserve. It is old, it is simple, and it requires no software beyond a spreadsheet. That combination makes it easy to dismiss as something you already know, even when you have never actually run the numbers on a specific decision. I have had this conversation with operators who have been in business for fifteen years and cannot tell me their break-even revenue for the current month. They know the feeling of the business. They do not know the number.
Most operators who skip this calculation are not skipping it because they find it too simple. They skip it because they are afraid of what the number will say. A break-even that requires 300 units a month when you have been averaging 220 is not a planning revelation. It is a verdict. And verdicts are uncomfortable. Which is exactly why you want the number early, before the lease is signed or the hire is announced.
On advertising: Before the campaign brief goes to your media buyer, put the break-even CAC and break-even ROAS in writing, not as targets to aspire toward, but as floors the campaign has to clear to justify continued spend. Break-even ROAS is 1 divided by your gross margin, period. At a 50% margin, that’s 2.0x. If your campaign is sitting below that floor after a reasonable run, pull the budget. Check whether the problem is bid costs, audience quality, or thin margin on the product itself, and redeploy spend where the math clears. No amount of A/B testing on ad copy fixes a margin problem.
On hiring: Stop asking “can we afford this person?” That question gets answered with optimism almost every time. Replace it with: what does this person need to generate or enable, at our current contribution margin ratio, to cover their fully loaded monthly cost? Calculate that number before the offer letter goes out. Write it into the first thirty-day check-in. If the number feels too awkward to put on paper, the hire is not ready to close.
On pricing: If you have not raised prices in the last eighteen months, there is a reasonable chance your break-even has crept upward while your price held flat. Supplier costs, software subscriptions, and payroll do not hold still. Run the numbers before the next renewal cycle. A modest price increase hits contribution margin directly, with no change to fixed costs, which means its effect on break-even is larger than most operators expect.
On the break-even chart: Draw it once. The visual is useful for building intuition about how fixed costs create a threshold and how contribution margin creates slope. After that, work from the number. The chart is a teaching tool. The number is what you manage against.
One honest caveat: this is a planning tool, not a forecast. It tells you what the world needs to look like for a decision to pay off. Whether the world cooperates is a separate question, and no formula answers it. The analysis gives you a target. Hitting it is still your job.
Used in
- ✓ Build a Complete Marketing Department
Used to set the minimum revenue targets that marketing campaigns and channel budgets must hit before they are considered viable, grounding ad spend decisions in contribution margin math rather than gross revenue. - ✓ The Missing Manual for FunnelKit
Used to calculate the break-even CAC and break-even ROAS for each funnel stage, so budget allocation decisions are anchored to margin reality rather than platform-reported ROAS benchmarks. - ✓ The Missing Manual for Make
Used to evaluate whether automating a workflow or hiring to handle it manually is the more cost-effective path, by modeling the fixed cost of automation against the variable labor cost it replaces.
FAQ
What is the break even analysis formula?
Break-Even Units = Fixed Costs ÷ Contribution Margin per Unit, where Contribution Margin per Unit = Selling Price, Variable Cost per Unit. For revenue dollars: Break-Even Revenue = Fixed Costs ÷ Contribution Margin Ratio, where Contribution Margin Ratio = Contribution Margin per Unit ÷ Selling Price.
What counts as a fixed cost vs. a variable cost?
Fixed costs do not change with your output: rent, salaried payroll, insurance, software subscriptions, loan payments. Variable costs scale directly with each unit sold or delivered: raw materials, shipping, payment processing fees, per-unit labor, sales commissions. If you’re unsure about a cost, ask whether it would disappear entirely if you sold zero units this month.
How often should I recalculate my break-even point?
At minimum, quarterly. Immediately whenever a material cost changes, such as a new hire, a lease renewal, a supplier price increase, or a change in your pricing. The number from twelve months ago is unreliable if anything in your cost structure has shifted.
Can I use break even analysis if I sell multiple products at different prices?
Yes, but you need a weighted average contribution margin: multiply each product’s contribution margin by its share of your sales mix, then sum across all products. Use that weighted margin in the standard formula. The result is only accurate while your sales mix stays stable.
Does breaking even mean my business is healthy?
Not necessarily. Breaking even means revenue covers cash costs. It does not mean you are generating a return on invested capital, covering the opportunity cost of your own time, or building financial resilience. Many operators who appear to break even are implicitly subsidizing the business with below-market compensation for their own labor.
How does break even analysis connect to advertising decisions?
Break-even CAC (the maximum you can spend to acquire one customer before that customer’s margin is consumed) and break-even ROAS (calculated as 1 divided by your gross margin) are direct applications of break even analysis to paid acquisition. Break-even ROAS is the floor your campaign must clear, not an industry benchmark. Every ad budget should be set relative to these numbers.
Further reading
- Walter Rautenstrauch, The Successful Control of Profits (B. C. Forbes Publishing Company, New York, 1930)The book that coined the term “break-even point” and gave the first systematic treatment of the chart as a planning tool; primarily of historical interest, but the framing of cost-volume relationships holds.
- Henry Hess, ‘Manufacturing: Capital, Cost, Profit and Dividends,’ Engineering Magazine (1903), pp. 892 to 898The earlier engineering article credited with the first graphical break-even chart, which Hess called a crossover chart. Citation as given in Mercados y Negocios (doi:10.32870/myn.vi48.7690).
- Charles E. Knoeppel and Edgar Seybold, Graphic Production Control (1918)The management engineering text that established the fixed/variable cost split and the graphical production chart that Rautenstrauch built on.
- Horngren, Datar, and Rajan, Cost Accounting: A Managerial EmphasisThe standard academic treatment of cost-volume-profit analysis, of which break even analysis is a part; rigorous if you want the full framework rather than the operator subset.
- U.S. Small Business Administration, “Calculate Your Startup Costs” (sba.gov)A practical, no-frills guide to applying the break-even formula in a startup context, with worked examples relevant to small business operators.
Sources:
Core formula and structure grounded in standard cost-volume-profit accounting as documented in publicly available sources including the U.S. Small Business Administration (sba.gov), Corporate Finance Institute, and Stripe’s financial education resources.
Historical attribution: Walter Rautenstrauch’s authorship of The Successful Control of Profits (B. C. Forbes Publishing Company, New York, 1930) confirmed via the Internet Archive digitized copy (archive.org/details/successfulcontro0000walt). Rautenstrauch’s role in coining the term “break-even point” is documented in a paper published in Mercados y Negocios (Redalyc, doi:10.32870/myn.vi48.7690), which cites Rautenstrauch 1930 as the source of the term. Rautenstrauch’s identity as an engineer and Columbia University professor is confirmed by Wikipedia and prabook.com. The break-even chart’s earlier precursor, Henry Hess (1903), is documented in the same Mercados y Negocios paper and corroborated by whichframework.org; the specific Hess article is ‘Manufacturing: Capital, Cost, Profit and Dividends,’ Engineering Magazine (1903), pp. 892 to 898, as cited in the Redalyc paper. Charles Edward Knoeppel and Edgar Seybold’s Graphic Production Control (1918) is cited in the same paper for the fixed/variable cost split. No claim is made that Rautenstrauch and Knoeppel collaborated personally; the history section says only that Rautenstrauch “built on” the prior work, which is supported by the secondary sources cited.
Pricing section illustrative examples (the 62.5%-to-50% margin scenario and the $120-to-$135 price-increase scenario) are the author’s own calculations applying standard cost-volume-profit mechanics. They are not drawn from an external study. The general principle that a price cut removes a disproportionately large share of contribution margin is documented in standard managerial accounting references including Horngren, Datar, and Rajan, Cost Accounting: A Managerial Emphasis.
Break-even ROAS formula (1 ÷ gross margin) is standard paid-media math documented across multiple practitioner sources including Amazon Ads educational materials and the Corporate Finance Institute. Break-even CAC application is the author’s own synthesis applying the standard contribution margin formula to a paid acquisition context. Hiring application mechanics are the author’s own synthesis. Subscription break-even framing is the author’s own synthesis and adaptation of the standard formula. All diagnostic procedures, operator framings, and threshold interpretations throughout this page are the author’s own and should be distinguished from the primary accounting literature.
Margin of safety mechanics sourced from standard accounting references consistent with Horngren et al. and confirmed by Corporate Finance Institute documentation.
Brian Kasday spent forty years in direct-response marketing before rebuilding the whole operation as a one-person shop. He writes The Operator’s Library — including “Build a Complete Marketing Department” — for operators who’d rather build it themselves than wait on someone else.
Build the department these ideas describe. The free companion kit: mmsvegas.com/resources.
More The Operator's Canon guides
Free · Operator Toolkit
Want the tools, not just the guide?
Get the free operator toolkit — templates and checklists for the systems you actually run, plus a note when this guide changes.
Get the free toolkit →