
Last updated: July 2026
Net revenue retention is the single number that answers the question every recurring-revenue operator should be asking first: does your existing customer base grow, hold flat, or shrink when you leave new acquisition out of the equation?
Most operators track top-line revenue, and most of the time it looks fine. New customers keep arriving; the total goes up. What that headline obscures is whether the underlying base of people who already pay you is getting more valuable or quietly bleeding out. You can run the acquisition treadmill fast enough to mask a serious retention problem for months, sometimes years, right up until you can’t.
NRR strips the new-customer noise out entirely. It isolates one cohort, the customers you had at the start of a period, and asks: twelve months later, are they paying you more, the same, or less? The answer tells you whether your business model actually works at scale, or whether scale just means a bigger leak to fill.
This metric came out of the SaaS world, where it’s been a boardroom staple for over a decade. But the logic applies to any business with recurring or repeatable revenue: agencies on retainer, membership communities, managed services, software platforms, subscription boxes, professional services firms. If customers can expand their spend, downgrade it, or leave entirely, you have an NRR. The question is whether you’re measuring it.
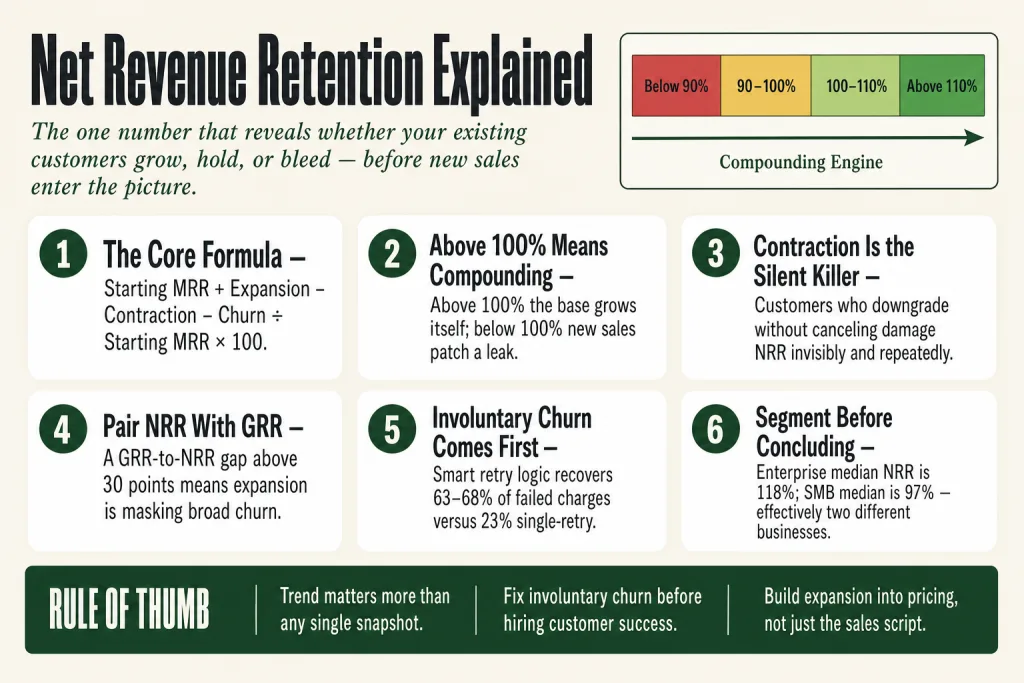
The idea in 30 seconds
- Net revenue retention measures what your existing customer base does to revenue, before a single new customer is added.
- The formula: (Starting recurring revenue + Expansion − Contraction − Churn) ÷ Starting recurring revenue × 100.
- Above 100% means the base is compounding on its own. Below 100% means every new sale you close is partly just patching the leak.
- NRR has four levers: expansion (upsells, seats, cross-sells), contraction (downgrades), churn (cancellations), and your starting base. Moving any one of them moves the number.
- Pair NRR with Gross Revenue Retention (GRR), a high NRR alongside a low GRR is a warning sign that a few big upsells are masking broad churn underneath.
- Trend matters more than the snapshot. A 102% NRR that’s falling every quarter is a more urgent problem than a 98% NRR that’s climbing.
Where Net Revenue Retention Came From
Account-level revenue tracking existed in enterprise software long before anyone gave it a standard name. What changed in the early 2010s was speed. SaaS subscriptions let hundreds of customers sign up, upgrade, downgrade, and cancel on monthly terms, often without talking to a salesperson. Operators needed one number that captured all of those moves at once.
Bessemer Venture Partners launched its BVP Cloud Index in 2013, and their subsequent State of the Cloud reports, still published annually, elevated Net Dollar Retention as a primary diligence metric. The Good / Better / Best shorthand (100%, 110%, 120%+) comes directly from those reports and has held as a shared reference point for over a decade. ICONIQ Growth’s annual series reinforced the same emphasis, showing top-quartile companies sustaining high NDR at early scale. Both firms drew on their own portfolio data, not a random market sample, so treat their benchmarks as directional rather than universal.
When SaaS companies began filing S-1 documents, SEC disclosure requirements effectively forced each company to define and report the metric publicly, creating a growing database of NRR figures at IPO. Snowflake’s 158% NRR at its September 2020 IPO became the most-cited high-water mark in SaaS benchmarking conversations. That’s really the whole story: a metric that existed in practice got a name, got a benchmark framework, and got a public data set all within about a decade. The vocabulary stuck because investors and operators needed shared language for comparisons, not because anyone handed down tablets from the mountain.
The Formula and What Each Piece Actually Means
The arithmetic is not hard. NRR = (Beginning recurring revenue + Expansion − Contraction − Churn) ÷ Beginning recurring revenue × 100. You can run it on MRR (monthly) or ARR (annual), just don’t mix them mid-calculation.
The more important thing is understanding what each term represents in plain English, because that’s where operators make errors.
Starting Revenue
This is the recurring revenue from the cohort of customers who were active at the beginning of your measurement window. New customers acquired during the period don’t enter this number, they start their own future cohorts. You’re isolating the existing base and watching what happens to it.
Expansion
Expansion MRR is additional revenue from existing customers who upgraded, bought more seats, or increased their usage. This also includes price increases applied to existing accounts, cross-sells to adjacent products, and usage overages on consumption-based plans. Expansion is the only component that can push NRR above 100%. It’s the compounding force, which is why companies that engineer natural expansion paths (more seats as teams grow, higher tiers as usage grows) tend to structurally outperform those relying on churn prevention alone.
Contraction
Contraction measures losses from customers who do not cancel but instead spend less, reducing the number of users, or downgrading from an enterprise package to a standard one. Contraction is the component most frequently omitted from small-operator calculations, and its omission makes NRR look falsely healthy. A customer who drops from a $500/month retainer to a $200/month retainer hasn’t churned, but they’ve contracted by $300, and that matters.
Churn
Churned MRR comes from customers who canceled or did not renew. This is the most visible form of revenue loss, and paradoxically, the one operators fixate on most, even though contraction often does more cumulative damage because it happens quietly and repeatedly without triggering any cancellation alert.
A Worked Example
Say you run a managed-services firm. At the start of Q1, your 40 active clients generate $80,000 in monthly recurring revenue. Over the quarter, two clients expand their scope, adding $6,000. One client downgrades a service tier, cutting $2,500. One client cancels entirely, removing $4,000.
NRR = ($80,000 + $6,000 − $2,500 − $4,000) ÷ $80,000 × 100 = 99.4%.
Technically below 100%. The base is slightly contracting before new business arrives. Not a catastrophe, but it means every new client you land is partly filling a hole, not purely growing the business. The question is whether you know that, and what you’re doing about it.
Trend matters as much as the snapshot. A company sitting at 102% and falling quarter over quarter needs attention even if the number is technically green.
Net Revenue Retention vs. Gross Revenue Retention: Why You Need Both
NRR is more complete than Gross Revenue Retention (GRR) because it incorporates expansion revenue from upsells and new seats, on top of losses from downgrades and cancellations. GRR strips expansion out entirely. It only measures what you lost to contraction and churn, relative to where you started.
That makes GRR look like the inferior metric, until you realize what it catches that NRR misses. A strong upsell motion can mask broad churn happening underneath. You could have a high NRR and still be losing customers at a worrying rate, if the accounts you’re keeping happen to be buying more.
Here’s what that looks like in practice. Say your NRR is 108%, looks great. But your GRR is 82%. That means you’re losing 18% of your base revenue to churn and downgrades every year, and your upsell motion is aggressive enough to more than cover the losses. The reported number looks healthy. The underlying business is fragile. The moment your best accounts stop expanding, or a couple leave, both numbers crater simultaneously.
A useful diagnostic frame: a GRR-to-NRR gap of 8 to 20 points is healthy; above 30 points suggests expansion is masking churn; below 5 points means you haven’t built meaningful expansion paths. Use GRR to assess churn health and product-market fit. Use NRR to assess expansion potential and revenue trajectory. GRR is the floor; NRR is the ceiling.
Track them together. If your ten largest accounts are expanding while everyone else quietly churns, your NRR tells a story your GRR contradicts. That contradiction, spotted early, is where interventions are still cheap.
Decomposing Expansion and Contraction: The Revenue-Level Counterpart to Cohort Retention
Most operators who track any retention at all track customer count, how many clients did we keep? That’s logo retention, or unit retention. It’s not nothing, but it misses the economic reality. NRR is revenue-weighted rather than logo-based, so it tells you whether your existing dollars are growing, not just whether customers are staying.
A client who stays but cuts their spend in half is counted as retained in logo metrics and as contraction in NRR. A client who doubles their spend is counted as one customer either way, but they’re contributing twice as much to your expansion MRR. NRR is cohort analysis at the revenue level rather than the unit level. The two should be read together.
When you pull NRR apart into its components and track each one separately, you get a diagnostic panel that tells you where to intervene:
- Expansion ratewhat percentage of your existing base upgraded, bought more, or triggered usage growth last period? If this is near zero, you have no natural growth motion in your customer base. You’re dependent on acquisition alone.
- Contraction ratewhat percentage reduced their spend without leaving? This is often an early-warning signal for eventual churn. Customers rarely go from full engagement to cancellation overnight; they downgrade first.
- Gross churn ratewhat percentage of the base left entirely? This is what GRR captures. If this is high, your NRR is cosmetic.
- Net changeexpansion minus contraction minus churn, expressed as a dollar amount. This is the real growth or decline of your install base in a given period.
Past a certain scale, expansion becomes the primary growth motion, not a supplement to acquisition. Expansion ARR has risen from roughly 25% of new ARR in 2022 to around 40% in 2024 on average, and reaches 58 to 67% for businesses above $50M ARR. You don’t have to be at $50M for this logic to apply, it applies the moment you have a customer base with room to grow.
Expansion comes from four sources worth distinguishing: seat or user growth (often triggered by the customer’s own team growth), tier upgrades (usually triggered by hitting limits or wanting premium features), cross-sells to adjacent products or services, and price increases on renewals. Seat expansion tends to be the largest contributor for most seat-based businesses. Usage-based models flip this hierarchy entirely, Snowflake’s consumption pricing was the structural driver behind its 158% NRR at IPO in September 2020, because customer data growth translated directly into higher spend without a sales conversation. That’s the design principle, not just a result of a good CS team.
Putting this to work? The ideas in the Canon are the foundation under the tactical playbook in Build a Complete Marketing Department — grab the free companion kit at mmsvegas.com/resources.
What a Good Net Revenue Retention Rate Actually Looks Like
Benchmarks in this space are genuinely useful and genuinely easy to misapply. The most important variable is who your customers are.
The median hides the real story: enterprise accounts tend to hold NRR well above 115% while SMB-focused businesses often sit in the 95 to 105% range. That gap exists because enterprise accounts have more seats to add, more departments to expand into, and more budget to upgrade. SMB customers have smaller footprints and more price sensitivity. If you’re benchmarking your SMB-focused managed-services firm against enterprise SaaS targets, you’ll demoralize your team for no reason.
With that caveat in place, here are the meaningful thresholds:
- Below 90%: Serious retention problem, the existing base is leaking fast. New acquisition at this level is partly a rescue operation.
- 90%, 100%: The existing base is shrinking, losses from churn and downgrades are beating expansion. You can sustain a business here, but you’re not compounding.
- 100%, 110%: Growing, but slowly. Watch whether upsells keep pace. Respectable for SMB-heavy businesses and a reasonable floor for professional services.
- Above 110%: Expansion clearly beats churn and contraction. The existing base is a genuine growth engine.
SaaS Capital’s 2026 benchmarking data, drawn from annual surveys of more than 1,000 private B2B SaaS companies, shows bootstrapped companies with $3M to $20M ARR at a median NRR of 103%, with 90th-percentile performers reaching 117.9%. Bessemer’s Good / Better / Best framework puts 100% as Good, 110% as Better, and 120%+ as Best, rough thresholds from their State of the Cloud reports that have held as a shared reference point across investor conversations for years.
At the high end, Snowflake’s consumption-based pricing drove a 158% NRR at its September 2020 IPO. Datadog reported trailing twelve-month NRR in the low 120% range as of Q1 2026, up from the low-to-mid 110s through 2024 and early 2025, when customers had been optimizing cloud usage after the pandemic-era over-purchasing boom. The recovery was driven by AI workloads generating new observability demand. Twilio peaked at roughly 140 to 143% NRR during its high-growth phase around 2020, fell into the low 100s during a period of slower expansion, and as of Q1 2026 had recovered to 114%, built on AI-driven communications use cases and multi-product adoption. Each of those trajectories is a case study in how NRR moves: up when customers have natural room to grow, down when that room disappears or gets competed away.
For operators outside pure SaaS, benchmarks are less published but the logic is the same. An agency on retainer that regularly identifies scope expansions, whose clients rarely cut their monthly, will have an NRR well above 100%. The benchmark you care about most is your own trajectory quarter over quarter.
Where Net Revenue Retention Applies Beyond SaaS
The list of business models where NRR is a genuine operating metric is longer than most operators assume.
Marketing and creative agencies on retainer. If you have clients on monthly retainers, your NRR tells you whether those retainers are growing, holding flat, or silently eroding, before project work or new-client revenue obscures the picture. Contraction here looks like a client cutting their monthly scope by $1,500 without ending the relationship. Expansion looks like adding a new channel or service to an existing account.
Managed IT, HR, or financial services. Monthly fee structures make the calculation straightforward. The relevant expansion paths are additional seats, additional services, and annual rate increases. Contraction paths are scope reductions at renewal.
Membership communities and subscription content. Annual membership programs with upgrade tiers have an NRR. Individual contributors who upgrade to community memberships, or who add event passes, generate expansion revenue. Members who downgrade from annual to monthly contracts generate contraction.
Software businesses of any size. This is the native territory for NRR, but it applies whether you have 20 accounts or 20,000.
Where NRR doesn’t cleanly apply: businesses with fully transactional, one-time revenue where there’s no ongoing payment relationship to measure. A home-services company that charges per visit, with no service plan, doesn’t have an MRR to calculate NRR on. They have repeat purchase rates and average order value trends, related but distinct concepts. If you’re in that model and want to apply NRR logic, the first step is constructing a recurring-revenue layer (a maintenance plan, an annual contract, a membership) that you can then measure.
NRR as a Compounding Diagnostic: What the Number Is Really Telling You
The mechanical fact of NRR, that an operator above 100% grows revenue without new customers, is well understood. The deeper implication is less often stated plainly: your NRR is a summary verdict on the entire post-sale experience your business delivers.
Think about what has to go right for NRR to be above 100%. Customers have to stay. They have to use what they bought. They have to derive enough value that they don’t downgrade. And at least some of them have to see enough additional value that they voluntarily expand. That’s not a sales result, it’s a product, service, and relationship result. NRR is what happens when retention cohorts are expressed in revenue terms rather than headcount terms.
Nick Mehta, Dan Steinman, and Lincoln Murphy made this point clearly in Customer Success (Wiley, 2016): no amount of new acquisition can sustainably offset a leaky retention base. NRR quantifies the leak rate, and the compounding rate, in one number.
This is why NRR doesn’t only depend on the customer success team. It requires input from product, pricing, onboarding, sales, and leadership, because it reflects the company’s ability to retain revenue and generate more of it from people already in the door. A product that solves the problem well generates expansion naturally. A product with confusing onboarding generates early contraction that shows up 90 days after the sale. A sales team that oversells generates churn. A pricing model with clear upgrade paths generates expansion. The metric captures all of it at once.
One way to use NRR as a diagnostic: pull it by segment. An aggregated NRR of 103% can hide a customer segment at 88% that’s slowly dragging the number down. Break it by customer size, acquisition channel, product tier, or industry vertical. The segment with the lowest NRR is almost always your biggest actionable finding, either because those customers are a poor fit and should come off your Ideal Customer Profileor because the experience you’re delivering to that segment is broken and fixable.
Two businesses starting at $1M in recurring revenue, one at 105% NRR and one at 95% NRR, diverge by roughly $270,000 in year three from the existing base alone, before a single new customer is added. Add acquisition on top and the gap amplifies. The 95% business needs acquisition just to stay still. The 105% business uses acquisition to accelerate something that was already growing.
That’s the difference between a leaky bucket and a compounding engine.
Where Net Revenue Retention Breaks Down or Misleads
NRR is a powerful metric. It’s also an imperfect one, and operators who treat it as the only number they need will get burned in specific ways.
The single-customer masking problem. A RevOps lead presents 118% NRR to the board. Everyone celebrates. Then someone pulls out the single enterprise account that expanded from $50k to $300k, and the number drops to 95%. The board stops celebrating. If you have any customer concentration, one or two accounts representing a disproportionate share of revenue, their expansion or contraction will dominate your NRR in ways that don’t reflect the health of the rest of your base. Always sanity-check NRR against a version with your top two or three accounts removed.
It’s a lagging indicator. NRR tells you what happened, not what’s about to happen. By the time churn hits your calculation, the relationship was already deteriorating for weeks. The most common early signal is a drop in login frequency or feature adoption, customers tend to disengage before they cancel. Leading indicators in product usage and support data are what let you act before the revenue moves.
Transactional revenue muddies the calculation. If your business mixes recurring revenue with significant one-time project revenue, NRR calculated only on the recurring layer can look misleadingly stable while the project revenue evaporates. And if you include project revenue in the base, you’re measuring something that doesn’t quite fit the formula. Be precise about what’s in the denominator.
Usage-based models introduce volatility in both directions. Snowflake’s consumption pricing drove extraordinary NRR at IPO, 158% as of July 2020. The risk is symmetry: usage can drop as fast as it grows. An NRR of 130% built on usage expansion can become 90% if customers reduce consumption in a tightened budget environment. The same metering that produces a high number on the way up transmits efficiency gains and budget cuts straight into the revenue line on the way down. ICONIQ Growth flags this in their Enterprise Five analysis: shifting from seat-based to usage-based pricing introduces volatility in both expansion and churn that traditional SaaS benchmarks don’t fully capture.
NRR doesn’t distinguish between voluntary and involuntary churn. Involuntary churn, customers lost to failed payments rather than deliberate cancellations, accounts for an estimated 20 to 40% of total churn across subscription businesses. Companies using intelligent payment retry logic recover roughly 63 to 68% of initially failed charges, compared to around 23% recovery for single-retry approaches. If you’re attributing all churn to product dissatisfaction, you’re probably over-diagnosing the customer experience problem and under-fixing the billing mechanics problem.
Common Mistakes
- Omitting contraction from the NRR formula — Add a dedicated contraction column to your monthly tracking. For every active account, compare starting MRR to ending MRR, any reduction short of cancellation is contraction and belongs in the formula. A common setup: pull account-level MRR into a spreadsheet at the start and end of each period, flag any row where ending MRR is lower than starting MRR and the account did not cancel, and sum those differences as your contraction figure. Without this step, four clients each quietly trimming $800/month from their retainer, $3,200/month total, never appear anywhere in your churn report.
- Reading a blended NRR without segment breakdowns — Calculate NRR separately by customer tier, acquisition channel, or industry vertical every quarter. The practical minimum: split by contract size into at least two groups (e.g. accounts above and below your median ACV). A blended 107% can conceal an SMB cohort running at 89% NRR, effectively a different business hiding inside your average. Once you’ve identified the lagging segment, you have a real decision to make about ICP, experience investment, or deliberate attrition.
- Treating NRR as a customer success metric owned by one team — Map each leaking component back to its operational root before assigning remediation. Churn from accounts that never activated a second feature is an onboarding problem, not a CS problem. Contraction at renewal is often a pricing-structure problem. Churn from over-promised accounts is a sales problem. Run a quarterly decomposition: for every dollar lost to churn or contraction in the period, identify which pre-sale or post-sale function owns the root cause. That exercise usually produces a shorter, more actionable list than a generic CS initiative.
- Ignoring involuntary churn when diagnosing low NRR — Before redesigning your product, onboarding, or CS motion, pull your churned accounts from the last six months and flag which ones ended with a failed payment versus an active cancellation. If more than 15 to 20% of churn is payment failures with no retry logic downstream, that’s your first fix, not a product issue. Configure smart retry sequencing (space retries across 3 to 7 days, vary the time of day), add a dunning email sequence, and enable a card updater service if your payment processor supports it. That combination recovers a materially higher share of initially failed charges than single-attempt retries, and it runs without ongoing labor.
- Ignoring the NRR, GRR gap — Calculate GRR alongside NRR every period and watch the gap. If NRR minus GRR exceeds 25 points, your expansion motion is covering for deteriorating retention, and that coverage disappears the moment a few key accounts stop growing or leave. The immediate diagnostic: identify your top five expanding accounts and model what happens to both metrics if those accounts hold flat for two quarters. If that scenario drops your NRR below 100%, your reported number is structurally fragile and needs a retention fix, not just continued upsell effort.
- Measuring NRR only annually — Shift to monthly calculation, even if the output is a rough spreadsheet. The practical reason: annual NRR collapses what might be a recoverable Q2 contraction cluster into a year-end number where the window to intervene has closed. Monthly tracking surfaces patterns, accounts contracting in the same vertical, or during the same budget cycle, while there are still accounts in similar situations that haven’t contracted yet. The calculation doesn’t need to be perfect to be useful; the discipline of doing it monthly is most of the value.
Operator’s Take
Let me tell you the thing that actually separates operators who move their NRR from those who talk about it: they stop treating the number as a report card and start treating it as a fault-finder. A report card just tells you how you did. A fault-finder tells you exactly where the pipe is leaking.
Here’s the judgment call most operators get wrong in 2025 and 2026: they see a blended NRR in the low 100s and conclude they have a retention problem. Then they hire a CSM or launch a quarterly business review program and wait. Six months later the number hasn’t moved. What they actually had, in most cases I’ve seen, was two separate problems running simultaneously: involuntary churn eating 20 to 30% of their cancellations while billing ran single-attempt retries, and a lowest-tier customer segment dragging the whole average down. Neither of those gets fixed by a better check-in call. You fix them with billing infrastructure and a hard conversation about whether that customer segment belongs in your ICP at all.
Fix involuntary churn before anything else. I mean it, before a new CSM, before a customer success platform, before anything. Involuntary churn is customers lost to failed payments, not deliberate cancellations, and it accounts for 20 to 40% of total subscription churn. That’s not a retention problem. It’s a billing configuration problem. Intelligent retry logic recovers roughly 63 to 68% of failed charges; single-attempt retries recover around 23%. A three-layer setup, smart retry sequencing, a dunning email flow, and a card updater service, takes days to configure and runs in the background forever. The ROI is almost always better than the ROI on headcount. Set it up first, then diagnose what’s left.
Segment NRR by customer tier before you do anything else strategic. The number is almost always dramatically different between your smallest and largest accounts. Small accounts tend to have higher churn and more contraction, they bought on price, they use less of the product, and they leave or downgrade at the first budget review. Optifai’s 2026 benchmarking data across 939 B2B SaaS companies puts enterprise median NRR at 118% and SMB median at 97%. That’s not a small gap, those are effectively two different retention businesses running under one roof. Once you see the split, you have three real choices: stop acquiring the low-NRR segment (tighten your Ideal Customer Profile), fix the experience specifically for that segment, or consciously focus resources where your NRR is already strong and let the other segment thin out. None of those is obviously right, it depends on your margin and headcount capacity. But the segmented view forces the decision instead of letting the aggregate hide it indefinitely.
Build expansion into the pricing architecture, not just the sales script. Operators who consistently achieve NRR above 110% aren’t doing it through heroic upsell conversations, they’re doing it by designing their service or product so that natural customer growth automatically translates into higher revenue. Datadog’s NRR recovered to the low 120s in Q1 2026 precisely because every new product a customer adopts and every additional host they monitor flows through directly into revenue. When AI workloads created new observability demand, that demand converted to revenue without a sales conversation. If your pricing model doesn’t have that structure, a better check-in cadence won’t move the number structurally. Value-based pricing and NRR are directly linked: when customers perceive increasing value, expansion becomes something they initiate rather than something you pitch.
One specific thing worth doing right now: go look at what Twilio’s NRR trajectory tells you. It peaked above 140% during the 2020 usage surge, cratered into the low 100s when customers tightened budgets, and recovered to 114% in Q1 2026 on the back of AI-driven communications use cases and multi-product adoption. That arc is a clean illustration of the fact that NRR is not stable, it follows where customer value perception and usage patterns go. If your customers’ problems are getting bigger and your product addresses them, NRR goes up without much effort. If their world shrinks or they find an alternative, NRR falls regardless of how good your CS team is. The job is to stay on the right side of that dynamic, which means watching where your customers’ problems are heading, not just how satisfied they are today.
Run it monthly, even informally. You don’t need a BI tool. A spreadsheet with four columns, starting MRR by customer, expansion, contraction, churn, and a formula at the bottom is enough. The discipline of doing it monthly forces you to notice contraction that would otherwise be invisible, and to spot churn trends two or three months before they become a pattern you can’t reverse.
Don’t frame NRR as a customer success metric owned by one team. It gets assigned that way and then under-resourced everywhere else. Your NRR is a function of your pricing model, your product quality, your onboarding experience, the fit of the customers you acquired in the first place, and yes, the relationship management after the sale. Trace weak NRR back through the formula to the leaking component, then trace that component back to its root cause. That root cause is often something that happened before the sale, not after it.
And don’t celebrate a high NRR without checking GRR. If the gap between your NRR and your GRR is more than 20 to 25 points, expansion is masking churn. When expansion slows or a big account renegotiates, both numbers fall together. The NRR headline can look green right up until the quarter it doesn’t.
Used in
- ✓ Build a Complete Marketing Department
Used to establish whether the existing customer base justifies acquisition investment, a business with NRR below 100% should fix retention economics before scaling acquisition spend. - ✓ The Missing Manual for FunnelKit
Used to design post-purchase automation sequences, upsell flows, renewal reminders, and downgrade-prevention triggers, that directly move the expansion and contraction components of NRR. - ✓ The Missing Manual for Make
Used to automate the monthly NRR calculation across CRM and billing data, and to trigger segment-specific retention workflows when contraction or churn signals appear.
FAQ
What is a good net revenue retention rate for a small business?
Depends heavily on who your customers are. For SMB-focused businesses, anything above 100% is strong; 95 to 100% is manageable but means you’re not compounding. For B2B services with larger accounts, 105 to 115% is a reasonable target. SaaS Capital’s 2026 benchmarking data on bootstrapped companies with $3M, $20M ARR shows a median NRR of 103%, with 90th-percentile performers reaching 117.9%, useful context, though their data skews toward growth-stage software. The more important benchmark is your own trend: are you moving the number quarter over quarter?
What’s the difference between net revenue retention and customer retention rate?
Customer retention rate counts logos, what percentage of customers stayed. NRR weights by revenue and includes expansion and contraction, so it tells you what happened to the dollars, not just the headcount. You can have 95% customer retention and still have an NRR below 90% if the customers who stayed heavily downgraded.
Can NRR exceed 100%?
Yes, that’s the goal. When expansion revenue from upsells, seat additions, and cross-sells exceeds revenue lost to churn and contraction, NRR goes above 100%. That means your existing customer base is growing revenue on its own, before a single new customer is acquired.
How often should I calculate NRR?
Monthly for internal monitoring is the right cadence for most small operators. Annual calculation is too lagging to act on, by the time you see a problem in annual NRR, it’s been building for six to nine months. Monthly tracking surfaces contraction trends and early churn signals while there’s still time to intervene.
Why is gross revenue retention (GRR) important if I already track NRR?
Because NRR can look healthy while GRR is quietly deteriorating, expansion from a few accounts can mask broad churn happening elsewhere. GRR strips expansion out and shows you the raw retention floor. If your NRR is high and your GRR is low, your retention is more fragile than the headline number suggests.
Does net revenue retention apply to non-subscription businesses?
Not cleanly, unless you construct a recurring-revenue layer, a service plan, retainer, or membership, that creates a measurable MRR base. Fully transactional businesses are better served by repeat purchase rate and average order value trends. But if there’s any recurring billing structure, NRR is calculable and worth tracking.
How does AI help with net revenue retention?
AI tools can help operators track NRR components more frequently, flag early-warning signals in product usage and billing data, and automate dunning sequences that recover involuntary churn. They reduce the manual overhead of running monthly NRR calculations across customer segments, which means the analysis actually gets done instead of being deferred. The judgment about what to do with the findings stays with the operator.
Further reading
- Bessemer Venture Partners, State of the Cloud (annual report, bvp.com): The benchmarking series that formalized NRR as a primary SaaS metric, with the Good / Better / Best framework. The BVP Cloud Index launched in 2013; State of the Cloud reports have been published annually since. Useful for benchmark context even if your business isn’t VC-backed.
- ICONIQ Growth, State of Software 2025 and Enterprise Five (iconiq.com/growth): Current NRR benchmark data showing the 110 to 120% stabilization range across their portfolio, alongside the Enterprise Five framework covering NDR, ARR growth, Rule of 40, net magic number, and ARR per FTE.
- Nick Mehta, Dan Steinman, Lincoln Murphy, Customer Success: How Innovative Companies Are Reducing Churn and Growing Recurring Revenue (Wiley, 2016): The book that put customer success operations on the map; directly relevant for the expansion and churn-prevention motions that drive NRR.
- SaaS Capital, 2026 Benchmarking Metrics for Bootstrapped SaaS Companies: Bootstrapped-company NRR data drawn from annual surveys of 1,000+ private B2B SaaS businesses, median NRR 103%, 90th percentile 117.9% for the $3M, $20M ARR cohort. More grounded in smaller, non-VC-backed businesses than most benchmarking sources.
- Paddle’s SaaS Metrics resources: Practical, operator-facing breakdowns of MRR, NRR, and GRR with worked examples and segment benchmarks.
Sources: Snowflake Inc. Form S-1 Registration Statement (filed August 2020, SEC), the primary document behind the often-quoted 158% net revenue retention figure; Nick Mehta, Dan Steinman and Lincoln Murphy, Customer Success (Wiley, 2016); Optifai Sales Ops Benchmark (Q2 2025 and Q1 2026, N = 939 companies); Bessemer Venture Partners, State of the Cloud and the BVP Cloud Index; ICONIQ Growth, Enterprise Five 2025 and State of Software 2025; SaaS Capital 2026 Benchmarking Metrics for Bootstrapped SaaS Companies and its 2025 Private B2B SaaS Growth Rate Benchmarks; Pavilion 2025 SaaS Benchmarks; ChartMogul SaaS Benchmarks 2024. On the payments figures: the involuntary-churn share and the retry-recovery rates quoted on this page come from billing and churn-tooling vendors who publish benchmarks without a stated sample, and whose commercial interest runs toward making recoverable churn look large. We removed roughly twenty such pages from this list in an October 2026 review because citing many restatements of the same unsourced numbers adds no evidence. Treat those two figures as directional. The diagnostic thresholds, the ordering of fixes and the worked examples in this article are ours.
Brian Kasday spent forty years in direct-response marketing before rebuilding the whole operation as a one-person shop. He writes The Operator’s Library — including “Build a Complete Marketing Department” — for operators who’d rather build it themselves than wait on someone else.
Build the department these ideas describe — the free companion kit: mmsvegas.com/resources.
More The Operator's Canon guides
Free · Operator Toolkit
Want the tools, not just the guide?
Get the free operator toolkit — templates and checklists for the systems you actually run, plus a note when this guide changes.
Get the free toolkit →How to cite: Net Revenue Retention (NRR). The Operator’s Canon, MMS Vegas. https://mmsvegas.com/library/net-revenue-retention-explained/