
Last updated: August 2026
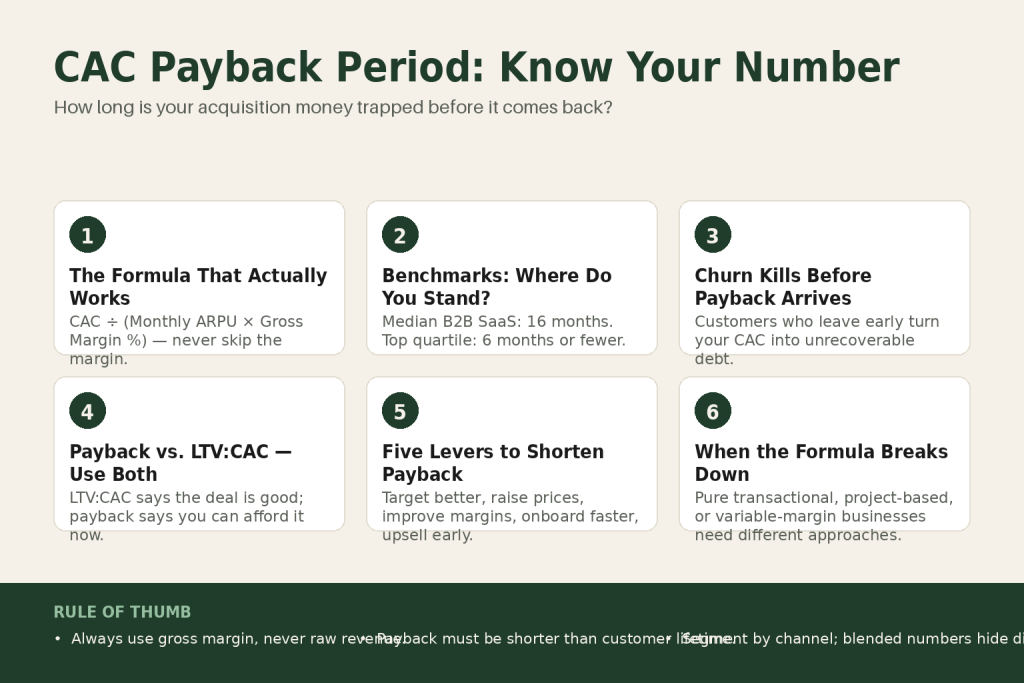
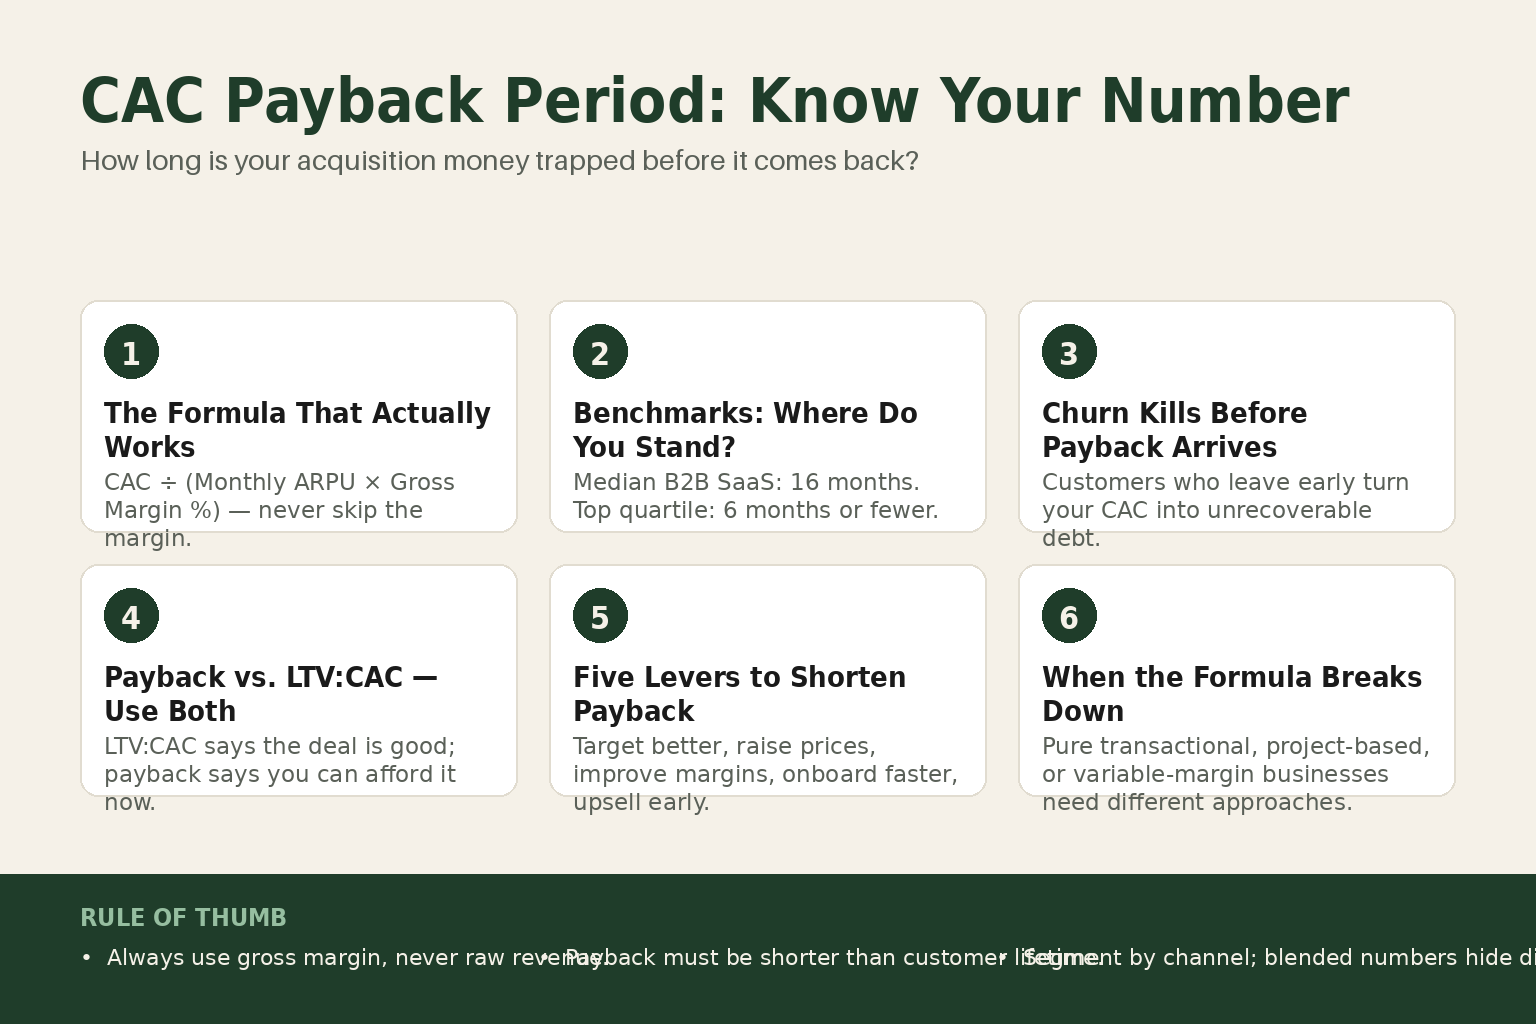
The CAC payback periodthe number of months it takes to recover your customer acquisition cost through gross-margin-adjusted revenue, is the single most honest answer to a question every operator asks but rarely quantifies: how long is my acquisition money trapped before it comes back? By the end of this page, you’ll be able to calculate your payback period accurately, read it against real benchmarks, and make a clear-eyed decision about how aggressively your business can afford to grow, and what to fix if the number scares you.
Every dollar you spend to acquire a customer is a short-term loan to the business. You hand that dollar to a marketing channel, a salesperson, an ad platform, and you wait. The customer starts paying you back monthly, in margin, not just revenue, and at some point the loan is repaid. Everything after that point is profit. The payback period tells you how long the loan runs.
That framing matters because CAC isn’t just an expense on your P&L. It’s debt: an upfront investment that needs to be earned back over time. If a customer churns before the payback period ends, that debt still exists, and it comes out of what the next cohort has to produce. That’s what makes the payback period more actionable than most metrics operators track. It connects your acquisition spending, your pricing, your margins, and your churn rate into a single number with a real cash consequence.
The idea in 30 seconds
- The CAC payback period is the number of months it takes to recover your customer acquisition cost through gross-margin-adjusted revenue from that customer.
- The cleaner formula: CAC ÷ (Monthly Revenue per Customer × Gross Margin %). Use gross margin, not raw revenue — the difference can cut your apparent efficiency in half.
- Churn is the silent killer: if customers leave before the payback date, that acquisition cost is never recovered, and the next customer has to cover the debt.
- Current benchmarks (2025 to 2026 data): median B2B SaaS sits at 15 to 16 months; top-quartile performers recover in 6 months or fewer; SMB-focused businesses should target under 12 months.
- A long payback period doesn’t just hurt profitability — it caps how fast you can grow without outside capital, because cash is tied up in each customer before it recycles.
- Shortening payback means one or more of: better targeting (lower CAC), higher initial prices or tiers, faster onboarding to value, or upsells within the first 90 days.
- The metric has real blind spots: it doesn’t fit pure transactional businesses, project-based services, or any model where repeat revenue isn’t reasonably predictable. Applying it where it doesn’t belong produces numbers that feel meaningful but aren’t.
Where the CAC Payback Period Came From
The concept predates SaaS by decades. Capital budgeting textbooks have used payback period since the mid-twentieth century to evaluate equipment purchases and factory expansions: spend money today, the asset generates cash over time, payback is when cumulative inflows equal the upfront outlay. Nothing exotic.
What the subscription software wave did was make this calculation urgent at the customer level. In a traditional product business, you collect most revenue at the point of sale. In SaaS, you collect it in small monthly slices over years, which creates a permanent gap between when you spend to win a customer and when you’ve fully recovered that spend. The metric became a go-to-market efficiency standard in the SaaS venture and CFO community over roughly 2010 to 2015, with no single credited inventor. It emerged from capital budgeting theory applied to subscription unit economics by practitioners across the investor and operator community. Bessemer Venture Partners codified benchmarks in their publicly available cloud metrics framework and their Scaling to $100M report. OpenView Partners circulated formulas that gained traction with growth-stage operators. From there it traveled into subscription boxes, agencies, retainer-based professional services, and e-commerce brands with measurable repeat-purchase rates.
CAC Payback Period Formula: What Each Piece Actually Means
There are several ways to write this calculation, and the differences matter more than people usually admit. Start with the clean version:
CAC Payback Period (months) = CAC ÷ (Monthly Gross Profit per Customer)
Where monthly gross profit per customer = average monthly revenue per customer × gross margin %.
So in full: CAC ÷ (ARPU × Gross Margin %).
Each input deserves a moment.
CAC: What actually goes in here
CAC is the total cost to acquire a new customer, marketing spend, sales team salaries, advertising costs, and any other acquisition-related expense. The common mistake is using only ad spend. If you have a salesperson whose time is split across prospecting, demos, and closes, a portion of that salary belongs in CAC. So do agency fees, tools whose primary purpose is lead generation, and the cost of content production that exists mainly to drive inbound leads. Undercount here and the payback period looks shorter than it actually is, which is exactly what gets operators into trouble.
ARPU: Use new-customer revenue, not blended
For subscription businesses, this is typically the monthly subscription fee; for other models, you might use average monthly purchase value or lifetime value divided by expected customer lifespan in months. The key word is new. Your blended ARPU across your whole customer base includes expansions and upsells that didn’t exist at acquisition. Using blended ARPU flatters the number. Build your payback calculation on what a fresh customer actually pays in month one.
Gross margin: the piece most operators skip
This is where most operators first go wrong. Divide CAC by revenue and you get a flattering number that is simply wrong. A CAC of $1,200 and $200/mo revenue looks like a 6-month payback, but at 50% gross margin the real payback is 12 months. Gross margin matters because you’re not recovering CAC with revenue, you’re recovering it with the margin dollars left after you’ve paid to actually deliver the product or service.
A worked example
Say you spend $60,000 on sales and marketing in a quarter and acquire 40 new customers. CAC = $1,500 per customer. Each new customer pays $200/month. Your gross margin is 70%. Monthly gross profit per customer = $200 × 0.70 = $140. Payback period = $1,500 ÷ $140 = 10.7 months.
At raw revenue it would look like 7.5 months. That’s a three-month flattery that changes your strategic picture considerably.
The timing lag that trips up team-level calculations
Lag the S&M spend. The spend that closed this quarter’s new ARR was largely last quarter’s budget. Mismatching the timing is the most common way the number gets reported too low. If your average sales cycle is 60 days, the marketing spend that generated this quarter’s new customers was mostly last quarter’s. Match the spending period to the acquisition period it actually produced.
CAC Payback Period Benchmarks: What the Numbers Actually Say
Benchmarks are one of those things where the headline number hides most of the story. “Aim for under 12 months” is the most common rule of thumb, and it’s not wrong, but it’s not the whole picture either.
Here’s what recent data shows:
- The median B2B SaaS company recovers its customer acquisition cost in 16 months. Top-quartile companies do it in 6 months or fewer; the bottom quartile takes 24 months or more.
- By market segment, per Bessemer Venture Partners’ Scaling to $100M report: SMB-focused SaaS should target under 12 months, mid-market under 18 months, and enterprise under 24 months.
- Sub-$5K ACV companies report a median near 9 months; deals above $250K ACV stretch to 24 months.
- High-performing SaaS companies reach an average CAC payback period of 5 to 7 months.
Two things worth flagging in these numbers. First, the top quartile is pulling away at 6 months or less, so a “fine” payback period is quietly becoming a competitive disadvantage. Companies getting more efficient are doing it by cutting and focusing, not by spending their way out of the problem.
Second, the enterprise numbers aren’t necessarily bad. Enterprise-focused companies can support longer payback periods than SMB-focused ones because they have higher contract values and lower churn rates. A three-year enterprise contract makes an 18-month payback perfectly manageable. What you’re really asking is: does the customer stay long enough to pay the loan back?
For operators outside pure SaaS: DTC and e-commerce companies generally need to be much faster, many aim for sub-6-month payback, because repeat purchase is not guaranteed. You can’t assume month 7 happens.
The honest benchmark framework for a small operator is this: compare your payback period to your average customer lifespan. If your median customer stays 18 months and your payback is 14, you’re barely breaking even on the average customer. If your median customer stays 36 months and your payback is 14, you’re in decent shape, the question is whether you can shorten that gap to fund faster growth without burning cash.
The Churn Problem: Why Your CAC Payback Number Might Be a Fiction
The standard formula has one quiet flaw: it assumes the customer stays. The formula doesn’t account for churn. If a customer cancels before the payback period ends, you won’t recoup your acquisition cost from them, you’ll have to recover it from a future subscriber instead.
This is the mechanism that can make a seemingly acceptable payback period quietly fatal. Say your calculated payback is 10 months and your average customer lifetime is 12 months. You look fine on paper. But if 20% of your customers churn before month 10, you never recover CAC on those customers at all. The next cohort then has to cover its own acquisition cost and absorb the write-off from the customers who left early. The more churn you have before payback, the longer working capital stays trapped.
There’s a ceiling worth knowing about. At any given churn rate, there’s a maximum CAC you can possibly recover: monthly gross margin divided by monthly churn rate. If your CAC sits above that ceiling, no amount of patience gets your money back. When payback is mathematically impossible given your churn rate, the metric is no longer telling you to optimize, it’s telling you to stop acquiring at that cost.
The practical fix is to track payback period alongside your churn data, not in isolation. A 10-month payback is manageable when customers retain for three-plus years. It becomes a serious problem when a meaningful share churn before month 12. Run the churn-adjusted version: what’s the payback period on customers who actually stay? If that number is dramatically different from your simple formula result, churn is your real problem, not CAC, not pricing.
The second churn interaction is about what churned customers reveal about acquisition quality. If customers are churning before the breakeven point, something’s wrong upstream. Segment your payback by channel and you’ll frequently find that one or two channels produce customers who leave before payback, while others produce customers who stay for years. That’s not a retention problem; it’s an acquisition targeting problem.
Putting this to work? The ideas in the Canon are the foundation under the tactical playbook in Build a Complete Marketing Department — grab the free companion kit at mmsvegas.com/resources.
CAC Payback Period vs. LTV:CAC Ratio, and Why You Need Both
These two metrics are related but they answer different questions, and conflating them is one of the more expensive diagnostic errors an operator can make.
The simplest way to think about the difference: LTV:CAC tells you whether the deal is good. CAC payback period tells you whether you can afford to do the deal right now. A 4:1 LTV:CAC ratio looks excellent on paper. But if you’re a bootstrapped operator and payback takes 30 months, you need to fund 30 months of growth-spend out-of-pocket before cash turns positive. A 3:1 LTV:CAC that takes 14 months to repay can still put you out of business. A 2:1 that repays in the first month funds your next hire.
LTV:CAC measures the value a customer delivers over their lifetime compared to what it cost to acquire them. It’s particularly sensitive to churn assumptions, if a customer leaves early, their lifetime value drops, and the ratio collapses. Churn isn’t baked into the payback calculation, which is both a weakness and a feature. Payback gives you a near-term, assumptions-light view of cash flow. LTV gives you the long-run economics picture. Neither alone is the whole story.
LTV:CAC is especially useful for early-stage companies investing heavily in customer acquisition, when the long-run bet matters most. At later stages, combining it with CAC payback adds depth, you can see not just whether the economics are good, but how quickly your investment is actually recovered.
Operators sometimes ask which one investors care about more. The honest answer: early-stage investors lean on payback precisely because LTV requires years of high-quality cohort data to be reliable. When you don’t have that data, payback is the more trustworthy signal. As the business matures and cohort data accumulates, LTV:CAC gets richer. Track both. Let them argue with each other.
How to Shorten Your CAC Payback Period: Where Operators Actually Have Leverage
The math is unambiguous: payback period = CAC ÷ monthly gross margin per customer. Shorten it by moving the numerator down, the denominator up, or both. But the practical levers are less symmetrical than the formula suggests, some are fast, some take quarters, and some are structurally limited by your market.
Lever 1: Improve acquisition targeting (lower CAC)
The most direct path. Chasing poorly-fitted prospects is expensive, longer sales cycles, more touches, lower close rates, and higher early churn all inflate CAC. Tightening your Ideal Customer Profile is often the fastest single move on this metric, because it compresses CAC and usually reduces churn simultaneously.
Channel mix matters here too. Run payback by channel rather than blended and you’ll see clearly which channels are subsidizing which. Concentrating spend on what actually works, and cutting what doesn’t, is consistently how operators move this number in practice.
Lever 2: Raise initial pricing or restructure tiers
Higher ARPU from day one is the cleanest lever because it compounds immediately. If you can raise the monthly price on new customers by 25%, you shorten payback by 20%, no operational change required. The resistance here is usually fear, not market reality. Most small operators are underpriced. Value-based pricing and a well-structured good-better-best tier both pull the average initial contract value up without necessarily losing volume.
An annual upfront option, even at a modest discount, has a dramatic payback effect. A customer paying $2,400 upfront versus $200/month recovers your $1,500 CAC in the first payment. Cash timing is everything when your constraints are operational, not just P&L.
Lever 3: Improve gross margin
Companies with the best CAC payback periods also tend to have higher gross margins. Improvements come from delivery efficiency, automation, better tooling, reduced hands-on service cost per customer, or from renegotiating cost-of-goods. In SaaS, this often means infrastructure costs. In services businesses, it’s delivery time per account. Every point of gross margin improvement directly compresses payback period, even if CAC and ARPU stay flat.
Lever 4: Accelerate time to first value
Underrated. Most pre-payback churn happens because customers haven’t experienced real value fast enough. Time to Value is a separate concept, but it directly defends your payback period by reducing the probability that a customer exits before the loan is repaid. Shorter onboarding, faster first win, lower friction in the critical first 60 days, these are retention investments that also function as payback-period insurance.
Lever 5: Engineer early upsells
Expansion MRR increases your effective ARPU without any additional acquisition cost, which compresses your payback period. An upsell in month two can shorten a 14-month payback to 10 months without changing a thing about how you acquired the customer. This is why net revenue retention and CAC payback interact so powerfully, expansion revenue does double duty, improving both metrics at once.
Where the CAC Payback Period Applies, and Where It Falls Short
CAC payback period works best in businesses with predictable recurring revenue. Subscription SaaS, membership services, retainer-based agencies, managed IT, recurring service contracts, these are all structures where monthly gross profit is relatively stable and payback math is clean. The formula was built for this environment.
Outside that structure, the metric gets slippery fast, and misapplying it produces numbers that feel meaningful but aren’t.
Pure transactional e-commerce
If a customer has no reliable reason to come back, the standard formula breaks. You have no monthly gross profit figure that’s actually predictable, you have a first purchase and a hope. For transactional DTC or e-commerce businesses with no measurable repeat-purchase pattern, trying to calculate CAC payback with a single order’s margin produces a number that flatters badly. You’d need cohort-level repeat-purchase data, actual observed rebuy rates by acquisition channel and time period, before the formula becomes trustworthy. In these businesses, the more honest question is: what’s the margin on the first order, and what does cohort data say about second- and third-purchase rates by month?
Project-based professional services
No recurring revenue means no denominator. An accounting firm, a creative agency, or a management consultant doesn’t have a reliable monthly gross profit per client, they have engagements. The closest analogue is: total project margin ÷ total cost to win the engagement. That gives you a rough “months equivalent” that captures the spirit of payback, but it’s a different calculation, and treating it as equivalent to the subscription formula overstates precision. Use it as a directional lens, not a benchmark-comparable number.
High-ACV enterprise with multi-year contracts
The formula still works here, but the interpretation changes significantly. A 24-month payback on a three-year contract with near-zero churn is a completely different situation than a 24-month payback on a month-to-month SMB subscription with 5% monthly churn. Well-capitalized enterprise sellers can absorb long payback periods because eventual recovery is nearly certain and contract length provides the cash flow runway to get there. Undercapitalized SMB sellers at 24 months are in a structurally different, and dangerous, position. Same number, opposite implications. Know which game you’re playing before you read the benchmark.
Businesses with highly variable gross margins
If your gross margin swings significantly by customer, by season, or by project type, a single blended payback figure is largely noise. A staffing firm, a construction subcontractor, or a professional services business where margin varies 20 percentage points between clients needs to calculate payback at the segment or engagement level, not blended, or the number misleads more than it helps.
The deeper limitation
Payback period doesn’t tell you why the number is what it is. Two businesses sitting at an 18-month payback can have completely different underlying problems, one has a CAC problem, the other has a margin problem. The formula doesn’t distinguish them. Always decompose the number: is CAC the issue, or is monthly gross margin the issue? The answer determines where you actually intervene.
Common Misunderstandings About the CAC Payback Period
“Shorter is always better.” Not exactly. A payback period under 12 months might actually indicate your business should be spending more aggressively, you’re recovering acquisition cost fast enough that the constraint isn’t economics, it’s conviction. If organic or referral has driven most of your growth and you’ve never tested paid channels at scale, your payback number is telling you the business can absorb more risk than you’ve been taking.
“The formula handles churn.” It doesn’t. The standard formula assumes the customer stays indefinitely. For a rigorous view, run churn-adjusted payback or at minimum compare your simple-formula result against your average customer lifespan. The gap between those two numbers is telling. (See the churn section above for the full treatment, this is flagged here only because it’s one of the most common miscalculations operators make.)
“I can use one blended number to manage the business.” The blended payback number is fine as a headline. It’s almost useless for making decisions. Segment by channel, by customer size, by product line. A 12-month blended number might be hiding a 6-month organic channel and a 24-month paid channel, those require completely different actions.
“Payback period only matters for SaaS.” It matters for any business that spends to acquire and then monetizes over time. An accounting firm on retainer, a pest control company with annual contracts, a gym with monthly memberships, an e-commerce brand with measurable repeat-purchase rates, all have meaningful payback periods. The subscription wrapper is convenient, not required.
Common Mistakes
- Using revenue instead of gross margin in the denominator — Swap raw ARPU for monthly gross profit per customer (ARPU × gross margin %) in your formula. Run the corrected version alongside your old number so you can see the gap, it’s often 3 to 5 months of phantom efficiency that was flattering your decisions. This is the single most common reason operators think their payback is fine when it isn’t.
- Tracking only a blended payback number — Rebuild your payback calculation as a channel-level table, not a single figure. Pull acquisition spend and new-customer gross margin separately for each channel. Any channel where payback exceeds your median customer lifespan should be cut or restructured before you spend another dollar scaling it. The channel that looks bad blended often looks catastrophic in isolation.
- Ignoring the timing lag between S&M spend and closed customers — Map your average sales cycle length. If it’s 60 days, pair this quarter’s new logos against last quarter’s S&M spend, not the same quarter. Build the lag into your model permanently; recalculate historical periods with the corrected timing and you’ll almost certainly find your real payback is longer than reported.
- Understating CAC by excluding salaries, tools, and agency fees — Run a full CAC audit: list every expense line that exists primarily to generate or convert leads, sales rep salaries and commissions, marketing platform fees, agency retainers, content production costs, lead-gen tools. Divide the total by new customers acquired in that same period. If your recalculated CAC is more than 20% higher than what you’ve been using, your payback period has been wrong for a while.
- Treating payback period as a standalone metric without checking average customer lifespan — Put payback period and median customer lifespan in the same row of your dashboard, not in separate reports. If the gap between them is under six months, that’s an emergency, not a warning. Any customer who churns in that window is a complete write-off. Track cohort survival rates at the payback milestone specifically.
- Applying the payback period formula to a business model where it doesn’t fit — Before you calculate payback, ask: do my customers generate a reliably predictable monthly gross margin? If the answer is no, because you’re purely transactional, project-based, or have wildly variable margins, the formula will produce a number that feels real but misleads. Use cohort-level repeat-purchase analysis for transactional businesses, engagement-level margin analysis for project-based work, and segment-level payback for variable-margin operations.
Operator’s Take
Most small operators have never calculated their CAC payback period properly. Not once. They look at ad spend, they look at revenue, and they call it a day. That’s not a small oversight, it’s the kind of blind spot that lets a growth phase quietly drain cash for two years before anyone notices.
So do it this week. Here’s exactly how. Pull your last full quarter of sales and marketing spend. Use gross margin in the denominator, not revenue. Lag your S&M spend by your average sales cycle length. Then run it separately for your top two or three acquisition channels. Two hours of work, maybe less if your numbers are already organized. When you’re done, you’ll almost certainly land in one of three situations, and each one calls for a different move.
Payback under 10 months, and you didn’t know it. Spend more. You’re recovering acquisition cost fast enough that the constraint isn’t economics, it’s conviction. The specific move: pick your highest-converting channel, double the monthly budget for 90 days, and track payback on those specific new customers separately. Don’t just pour more into the blended pool, isolate it so you can measure whether the channel holds its efficiency at higher spend. If payback stays under 12 months on the incremental cohort, you have a green light to keep scaling. Most operators in this position are leaving growth on the table because the number scared them before they actually calculated it.
Payback at 12 to 18 months, customers mostly staying 24 to 36 months. Functional, but every new customer requires cash to sit idle for over a year. The fastest combination I’ve seen move this number: introduce an annual upfront option (even at a 10 to 15% discount) and tighten your ICP to cut slow-to-close, early-to-churn prospects. A customer paying $2,400 upfront instead of $200/month recovers a $1,500 CAC in the first payment. Narrowing your ICP typically compresses sales cycles, and shorter cycles mean lower fully-loaded CAC. Do both for two or three quarters and payback can shift from 15 months to 8 months without touching your delivery model. While you’re there: look at your month-2 and month-3 upsell rates. An expansion offer that converts 25% of new customers in the first 90 days adds to effective ARPU without touching CAC, and it can take another two or three months off payback by itself.
Payback longer than your average customer lifetime. This is the one that kills businesses quietly. Every early churner is a write-off the next cohort has to absorb. The temptation is to cut acquisition spend, that’s the wrong move. Cutting spend doesn’t fix the underlying problem; it just slows the bleeding while the root cause stays in place. Instead: pause or sharply reduce spend on whichever channels are producing your highest-churn customers. Pull cohort data by channel and find the worst offender, it’s almost always one or two sources. Stop funding those specifically. Then diagnose what’s driving early exits: product mismatch, onboarding failure, or wrong-segment targeting. Fix the upstream problem before you reinvest in volume. Set a concrete re-entry rule, something like “resume full spend on this channel when its channel-specific payback is below median customer lifespan”, so the decision isn’t discretionary the next time around. Track payback and average lifespan monthly on a single row in your dashboard. When the gap closes, start reinvesting in volume.
One pushback on the standard guidance: the obsession with getting payback under 12 months as if it’s a universal law. It isn’t. CAC payback periods for SMB customers should be approximately 6 to 18 months, whereas enterprise customers can run as long as 24 to 36 months. A pest control company with three-year service agreements or a managed IT firm with sticky contracts can run a healthy operation at 18 to 20 months. The 12-month rule was calibrated for VC-backed SMB SaaS with meaningful monthly churn. Know which game you’re playing before you grade your number.
On AI tools: where they earn their keep is building and maintaining the model. Automating the monthly pull of CAC inputs, ARPU by cohort, and gross margin per acquisition channel into a dashboard that recalculates payback automatically cuts out the tedious part. The judgment about what the number means for your specific business, and which lever to pull, stays with you. That part doesn’t automate.
Used in
- ✓ Build a Complete Marketing Department
Used to evaluate channel efficiency and set acquisition budget ceilings, channels whose payback period exceeds the customer’s expected tenure get cut or restructured first. - ✓ The Missing Manual for FunnelKit
Applied when diagnosing funnel performance: payback period by entry point reveals which funnel paths produce economically viable customers and which produce expensive early churners. - ✓ The Missing Manual for Make
Supports building automated CAC and payback dashboards that pull acquisition spend, new customer revenue, and margin data into a monthly recalculation without manual spreadsheet work.
FAQ
What is a good CAC payback period?
For SMB-focused SaaS and subscription businesses, under 12 months is generally healthy, and best-in-class operators reach 5 to 7 months. Enterprise sellers can reasonably operate at 18 to 24 months given longer contract lengths and lower churn. The most useful comparison is always your payback period versus your median customer lifetime, payback must be shorter than tenure.
Why should I use gross margin instead of revenue in the CAC payback formula?
Because you’re recovering CAC with the cash left after you’ve paid to deliver your product or service, not with top-line revenue. Using raw revenue ignores delivery costs and makes payback look shorter than it actually is, sometimes by several months.
How does churn affect CAC payback period?
Churn is not built into the standard formula, which assumes customers stay indefinitely. If customers leave before the payback date, you never recover that acquisition cost, and it becomes a write-off against future customers. High churn before payback is one of the fastest ways a growing business can quietly destroy cash.
How is CAC payback period different from LTV:CAC ratio?
LTV:CAC measures the long-run quality of your acquisition economics, whether the deal is profitable over a customer’s lifetime. CAC payback measures cash timing, how long your acquisition spend is frozen before it returns. A business can have a strong LTV:CAC ratio and still be cash-constrained if payback is slow.
Does CAC payback period apply to non-SaaS businesses?
Yes, to any business that spends to acquire customers and monetizes them over multiple transactions or periods. Membership businesses, agencies on retainer, managed service providers, and e-commerce brands with measurable repeat-purchase rates all have meaningful payback periods. For purely transactional businesses with no reliable repeat-purchase pattern, the formula breaks down, you’d need cohort-level rebuy data to make it work.
How do I shorten my CAC payback period without cutting acquisition spend?
The three most direct levers are: improve acquisition targeting to lower CAC (better ICP, better channels), raise initial pricing or push annual prepayment to increase month-one gross margin contribution, and engineer upsells or expansion in the first 60 to 90 days to increase effective ARPU without additional acquisition cost.
Further reading
- Bessemer Venture Partners, “Scaling to $100M” and Cloud Metrics Atlas (bvp.com): The primary source for the SMB/mid-market/enterprise CAC payback targets cited throughout this page. Bessemer’s publicly available cloud metrics framework defines the formula and publishes benchmark ranges by ARR scale and customer segment.
- The SaaS CFO, “How I Calculate the CAC Payback Period” (thesaascfo.com): Ben Murray’s practitioner-level breakdown of the gross-margin-adjusted formula, including a separate treatment of the dollar-based payback period for operators running hybrid subscription and variable-revenue models.
- Baremetrics Open Benchmarks (baremetrics.com/open-benchmarks): Live benchmark data aggregated from 800+ small and medium subscription businesses, segmented by MRR range, one of the few places you can compare churn, LTV, and growth metrics against companies at your actual revenue level rather than generic industry averages.
Sources: Benchmarkit 2025 SaaS Performance Metrics Report (via Drivetrain.ai); Aleph × Benchmarkit SaaS & AI Performance Benchmarks 2026 (342 companies); Optifai Sales Ops Benchmark, Q2 2025, Q1 2026 (939 companies); Baremetrics Academy (April 2026); Stripe Resources, CAC Payback Period (September 2024); Wall Street Prep SaaS Metrics Guide; The SaaS CFO (Ben Murray); GigRadar Payback Period Calculator and Benchmarks (July 2026); Shopify Blog, CAC Payback Period (2026); First Page Sage SaaS CAC Payback Benchmarks Report (2025); MetricHQ CAC Payback Period reference (July 2026); Bessemer Venture Partners, Scaling to $100M (bvp.com/atlas/scaling-to-100-million); Bessemer Venture Partners, 10 Laws of Cloud (bvp.com/atlas/10-laws-of-cloud).
Brian Kasday spent forty years in direct-response marketing before rebuilding the whole operation as a one-person shop. He writes The Operator’s Library — including “Build a Complete Marketing Department” — for operators who’d rather build it themselves than wait on someone else.
Build the department these ideas describe — the free companion kit: mmsvegas.com/resources.
More The Operator's Canon guides
Free · Operator Toolkit
Want the tools, not just the guide?
Get the free operator toolkit — templates and checklists for the systems you actually run, plus a note when this guide changes.
Get the free toolkit →