Table of contents
- You don’t need an analyst — you need four numbers
- The four diagnostics, and what each one is telling you
- Turning the numbers into a decision: the $500/hour read
- The AI workflow that reads the data for you
- From reading the data to fixing it: the one-variable test
- When you don’t have enough traffic to trust the data
- Automate the boring part of the pull
- Frequently asked questions
You launched the thing. The emails went out, the ads ran, the page took orders. Now you’re staring at a dashboard with forty numbers on it, and you have the same question every solo operator has at this moment: which of these actually matter, and what am I supposed to do about them?
A big company hands that problem to an analyst. You don’t have one. You also don’t need one — not for this. Learning to read your marketing data without an analyst is a learnable skill, and it’s a smaller skill than the dashboards make it look. You don’t need a statistics background or a marketing degree to understand what your funnel is telling you. You need to know which handful of numbers carry the signal, what each one means when it’s low, and a repeatable way to turn that into the single change worth making next.
That’s the whole job. Here’s how to do it yourself.
You don’t need an analyst — you need four numbers
Every funnel has a critical path: the sequence of steps a stranger takes from first encounter to first purchase. They see an email or an ad, they land on a page, they reach a checkout, they buy — and at the moment of buying, they either take the add-on you offered or they don’t. Each of those steps has a conversion rate, and each conversion rate is a diagnostic signal. Not a vanity number to feel good or bad about — a signal that points at one specific thing that’s working or one specific thing that’s broken.
The mistake almost everyone makes is trying to watch everything. Sessions, bounce rate, time on page, impressions, follower counts — the dashboard will happily show you a hundred metrics, and most of them are what marketers call vanity metrics: numbers that look impressive on a screen but don’t tell you whether your marketing is driving the business. Ignore them until you have a reason not to. The four numbers below sit on the critical path, and they’re the ones that earn their place.
The rule: data is only useful if it tells you something actionable. Not “we made X dollars” or “conversion was Y percent,” but “this specific step underperformed in this specific way, which suggests this specific change.” If a number can’t lead you to a decision, stop watching it.
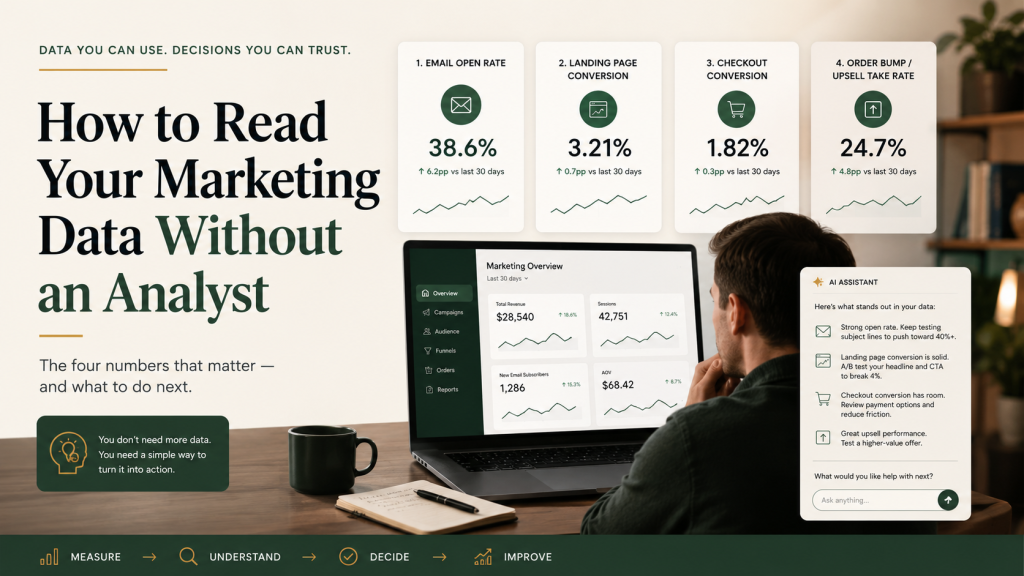
The four diagnostics, and what each one is telling you
Read these in order. They map the path a buyer walks, so a problem early in the path explains a lot of what looks broken later.
1. Email open rate. This is your first diagnostic. A low open rate on a launch or broadcast email is almost always one of two things: a subject-line problem or a list-warmth problem. The subject line you can fix immediately — write five new ones and test them. List warmth is slower: if your list barely knows you, no subject line saves it, and the fix is either more relationship-building over time or a smarter way of segmenting who gets what. The number itself doesn’t tell you which of the two it is. Your knowledge of how warm the list is does. One caveat worth holding: open rate is directional, not gospel — privacy features can inflate opens — so pair it with click rate, replies, revenue per recipient, and list-segment behavior before making a major decision.
2. Landing page conversion rate. Of the people who clicked through, how many took the action the page asked for — opted in, or moved to checkout? A low number here points at one of three things, and they have different fixes. There’s a mismatch between where the traffic came from and what the page says (the ad promised one thing, the page delivered another). There’s an offer that isn’t compelling enough for that audience. Or there’s a page-experience problem — slow load, bad mobile layout, confusing design. Check them in that order; the first is the most common and the cheapest to fix.
3. Checkout conversion rate. Of the people who reached the checkout, how many actually completed the purchase? High abandonment at checkout is usually a trust issue (not enough proof near the payment form), a friction issue (too many fields, a confusing flow), or a price-shock issue (the price landed wrong in the context the page set up). Test one hypothesis at a time. A guarantee badge next to the button tests trust. Removing two form fields tests friction. Re-framing the price against the value stack tests price shock.
4. Order bump and upsell take rate. Watch how many of your buyers add the order bump and accept the one-click upsell. That number is the scoreboard for both offers. A healthy order bump converts somewhere around twenty to thirty percent of buyers; a one-click upsell, roughly fifteen to twenty-five percent. If yours are well below that, three things could be wrong, and you check them in this order: the offer itself is wrong, the price is wrong, or the way you’re presenting it is wrong. This number matters more than it looks, because the bump and upsell are where a funnel goes from losing money on traffic to breaking even on it. (If you haven’t added these yet, that’s the highest-leverage gap to close first — see how to build a sales funnel without a team.)
Four numbers. Each one points at a specific step, and each low number narrows the diagnosis to two or three named causes. That’s what an analyst does for a company — isolate the step, name the likely cause, propose the test. You can do the same read on your own funnel in twenty minutes.
Turning the numbers into a decision: the $500/hour read
A consultant who charges $500 an hour isn’t worth it because they know secret numbers. They’re worth it because they look at your numbers and tell you the one thing to change next — including the thing you don’t want to hear. That’s the read you’re learning to do for free.
The discipline is to resist fixing everything at once. When you see three soft numbers, the instinct is to overhaul all three. Don’t. Find the step on the critical path where you’re losing the most people relative to what’s normal, and fix that one first, because a leak early in the funnel makes every number after it look worse than it is. If your landing page only converts at half the rate it should, your checkout number is being judged on a thin, poorly-qualified trickle — fix the page and the checkout number may sort itself out.
One more habit worth stealing from the expensive consultant: separate the number from the verdict. A low number is information, not a judgment on your business. It means you now know where to point your next hour of effort. That reframe keeps you reading data instead of avoiding it.
The AI workflow that reads the data for you
Here’s where the solo operator actually closes the gap with the company that has an analyst. You can hand your numbers to an AI assistant and get a structured diagnostic read back in a few minutes — the kind of synthesis that used to take a research analyst at $200 an hour and a week of turnaround. The trick is to ask for the read the way a sharp operator would, not the way a search box would.
Paste in the actual numbers — each email’s open and click rate, your landing-page and checkout conversion, your bump and upsell take rates, gross revenue, order count, average order value, refunds — plus any customer feedback you collected. Then ask for five things specifically: what worked and should be preserved exactly, what underperformed and the most likely diagnosis for each, the single highest-leverage fix to make before the next launch, three specific A/B tests to run next, and what the data implies about your market or positioning beyond this one campaign.
Add one instruction most people skip: tell it to be direct and to include the things you might not want to hear. Without that line, an AI assistant drifts toward diplomatic framing that softens the message — which is the opposite of what diagnostic work needs. You want the unfiltered read, the way you’d want it from a consultant you’re paying to tell you the truth.
Two honest caveats. An AI assistant has never met your customers, so its read on why a number is soft is a smart hypothesis, not a fact — you confirm it against what you actually know about your buyers. And it can be confidently wrong about specific figures, more often with numbers than with reasoning, so verify any stat it hands back before you act on it. Used inside those guardrails, it turns a pile of metrics into a ranked list of decisions, which is exactly the bottleneck a solo operator hits at this stage. A capable AI plan runs about $20 a month — the cheapest analyst you’ll ever staff.
From reading the data to fixing it: the one-variable test
Reading the data tells you where the leak is. A test tells you whether your fix actually works. This is the discipline that separates operators who compound improvements from the ones who argue about button colors all day, and it long predates the internet — direct-response companies were splitting mailing lists and counting which version pulled more orders decades before anyone had a dashboard.
Three mistakes waste most tests. Avoid them and you’re already ahead of nearly everyone running tests right now:
- Testing things that don’t move the needle. Button colors, font tweaks, a comma here or there. Even when you win, the lift is tiny and the time is gone. Test things that, if they win by a real margin, would change how you think about your business.
- Testing too many things at once. Change the headline and the image and the bullets and the price together, and even if the page wins you don’t know which change did it. You have a victory you can’t repeat. One variable per test.
- Calling a winner too early. The biggest one. Four conversions versus two on a couple hundred visitors is noise, not a result — run it again and it could flip. As a rough rule of thumb from the book, aim for around three hundred conversions per variant before treating the outcome as reliable; smaller expected lifts require more data. For most small funnels that means a test runs for weeks, not days. That’s fine; it runs in the background while you build the next thing.
Test in priority order, because not every element carries the same weight. Headlines first — the highest-leverage element on any page. Offers second — what’s included, how it’s priced, the guarantee. Pricing third, and rarely; you’ll usually find you’ve been undercharging. Risk reversal fourth — the strength of the guarantee. CTA language fifth. Button color last, if ever.
If you build your funnel on FunnelKit Pro, the testing engine is already inside it — you open a page, add a variant, set a fifty-fifty split, and its analytics track each version until there’s a clear winner, which then takes all the traffic. The same split logic exists for your emails, so you can test a subject line on a slice of your list and auto-send the winner to the rest. (One gotcha worth knowing if a test ever reads strangely: a caching plugin can quietly break funnel variants by serving a stale version.) The point is that the tool handles the mechanics; your job is to design tests worth running and write down what each one taught you.
The reason to bother is compounding. You don’t need a miracle test. A twenty-percent lift on a headline, a fifteen-percent lift on an offer, a ten-percent lift on checkout — each modest on its own — stack to more than a fifty-percent improvement in funnel economics. That’s the game: a disciplined cadence of small, honest tests, documented over a year.
When you don’t have enough traffic to trust the data
Here’s the honest limit. A test is a luxury that requires traffic. If your funnel sees two hundred visitors a month, you do not have enough volume to run a meaningful A/B test, and any “winner” you call is a coin flip you’re dressing up as a decision. Fix the traffic first.
In the meantime, the substitute for statistical testing is qualitative research, and at low volume it’s actually better. Talk to the customers you do have. Read the emails they send. Watch session recordings if your analytics offers them. Sit in the forums and groups where your market hangs out and write down the exact words they use to describe the problem. One good customer conversation will teach you more than an underpowered test on two hundred visitors ever could — and the language you collect feeds straight back into your sales page and your welcome emails.
Automate the boring part of the pull
Reading the data is the skill. Gathering it every week is the chore — logging into four tools, copying numbers into a sheet, doing it again next Monday. That part you can hand off to automation. A no-code automation platform like Make can pull the numbers from your email tool, your store, and your ad accounts on a schedule and drop them into one place, so the only thing left for you is the read. If you go that route, keep an eye on the credits each scheduled pull consumes — the Make Guides library walks through how that pricing works. Automate the collection; never automate the judgment. The decision about what to change next is the one part of this that’s actually yours to make.
Want the framework as a working tool? Grab the free 50-prompt marketing library — including the launch-data diagnostic prompt and the A/B-test design prompt referenced above — at Get the free prompt library →. And if you want the whole system, from reading data to building the funnel that produces it, Build a Complete Marketing Department lays it out end to end at mmsvegas.com/marketing-department.
Frequently asked questions
Do I really need an analyst or a data tool to understand my marketing? No — you can read your marketing data without an analyst. You need four numbers off your critical path — email open rate, landing-page conversion, checkout conversion, and bump/upsell take rate — and a habit of asking what each one points to when it’s low. That’s a learnable skill, not a degree.
Which marketing metrics actually matter for a small business? The ones on the path to a sale. Watch the four diagnostics: email open rate, landing-page conversion, checkout conversion, and bump/upsell take rate. Treat sessions, impressions, bounce rate, and follower counts as vanity metrics until you have a specific reason to look at one of them.
Can AI analyze my marketing data for me? Yes, for the read. Paste in your real numbers and ask for what worked, what underperformed with a diagnosis, the single highest-leverage fix, and three tests to run next — and tell it to be direct, including what you don’t want to hear. Then verify any specific figure it cites and confirm its reasoning against what you know about your customers.
How much data do I need before I trust an A/B test? As a rough rule, around three hundred conversions per variant, and more for smaller expected lifts. Below roughly a few hundred conversions, you’re reading noise. If your traffic is too low for that, use customer conversations and session recordings instead until volume catches up.
What should I test first? Headlines, then the offer, then price, then your guarantee, then CTA wording. Button color is last, if ever. Test one variable at a time so you know what actually moved the result.
How often should I look at the numbers? A focused read after each launch or campaign, and a light weekly check on the four diagnostics. Automate the data collection so the only recurring work is the decision about what to change next.