
Last updated: September 2026
Share of search is the ratio of branded organic search queries for your business versus the total branded search queries for all competitors in your category. By the end of this page, you’ll know how to run the measurement for free, how to read what the trend is actually telling you, and, just as importantly, when to put the metric down because it doesn’t apply to your situation.
The appeal is straightforward. Market share is expensive to measure, slow to report, and often impossible to get without paying a research firm. Branded search data costs nothing, updates weekly, and goes back to 2004. If the correlation between the two holds in your category, and the IPA’s cross-industry think tank found it holds across a surprisingly wide range of them, you’ve just acquired a meaningful leading indicator for almost no effort.
That said, a lot of operators hear about share of search, pull up Google Trends once, see a noisy line, and either overclaim or dismiss. Neither is right. The metric earns its place when you understand what it’s actually picking up, what distorts it, and what questions it can’t answer at all.
The idea in 30 seconds
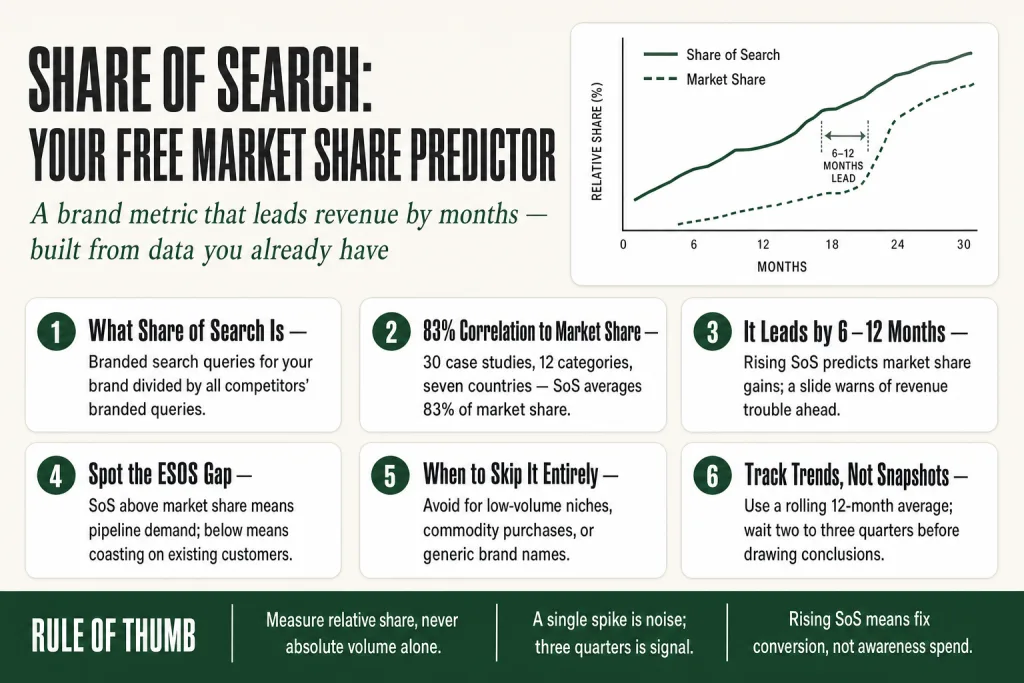
- What it is: Share of search (SoS) is the percentage of branded organic search queries your business captures relative to all competitors in your category, measured free with Google Trends.
- Why it matters: The IPA’s cross-industry think tank, led by James Hankins and presented at IPA EffWorks Global 2021, found that across 30 case studies in 12 categories and seven countries, SoS represents roughly 83% of a brand’s market share on average, and tends to lead actual market share changes by 6 to 12 months.
- The core signal: When your SoS rises relative to competitors, market share typically follows. When it slides, revenue trouble often arrives months later, giving you an early warning most lagging metrics don’t.
- The honest caveat: It works best for categories where people actually search brand names, automotive, insurance, software, professional services. It breaks down in ultra-niche B2B, commodity categories, and for brands whose names double as common words.
- How to run it: Open Google Trends, compare your brand name against 3 to 4 direct competitors over a rolling 12-month period, export to a spreadsheet, and calculate each brand’s share of the total index. Repeat quarterly.
- Operator takeaway: Treat it as a directional compass, not a precision instrument. A rising trend confirmed over two or three quarters is signal. A single-week spike is noise.
Where Share of Search Came From, and Why It Spread Fast
Les Binet, Group Head of Effectiveness at adam&eveDDB, went public with share of search on 14 October 2020 at IPA EffWorks Global. He’d been sitting on the data for six years before that. His framing was deliberately un-hyped: fast, cheap, predictive. The metric is a brand’s share of organic Google search queries divided by total branded searches across the competitive set, not paid advertising, not category search, just people typing your name into Google.
Binet tested the idea across three categories with very different purchase cycles: automotive, energy, and mobile handsets. In each, share of search correlated with actual market share and led it, by up to a year in automotive. That lead-time finding is what made the marketing world pay attention.
James Hankins of Vizer Consulting then took it further. At IPA EffWorks Global 2021 he presented think tank findings from 30 case studies across 12 categories and seven countries: SoS appeared to represent 83% of a brand’s share of market on average. The researchers were careful to say correlations, not causal relationships, and that the ratio varies by category. It’s a strong signal. It’s not a law of physics.
What share of search updated wasn’t measurement technology, it was the logic of share of voice, an older idea that a brand owning a disproportionate slice of category media spending tends to grow. Share of search applies that same thinking to observable behaviour: what people actually do rather than what brands spend to reach them.
The Problem Share of Search Actually Solved
Before share of search, most small and mid-sized businesses had two options for understanding their competitive brand position. They could commission a brand tracker, a quarterly or annual survey measuring awareness, consideration, and preference, which cost serious money and delivered data that was months old by the time it landed. Or they could look at their own sales and make educated guesses about what competitors were doing.
Binet had spent thirty years observing that the relationship between conventional tracking metrics and actual purchase behaviour is often surprisingly weak. Survey respondents tell you what sounds right. Search queries show what they actually did next.
For operators without access to competitor revenue data, which is most of us until rivals are publicly traded, branded search volume is one of the few things you can observe directly. And there’s a timing advantage that matters: when your share of search starts sliding in Q1, you’ve got a window to respond before the revenue decline shows up in Q3 financials. Most lagging metrics don’t give you that window. By the time the sales numbers confirm the problem, the problem is already old.
How Share of Search Works, and What the Numbers Actually Mean
The arithmetic is almost insultingly simple. If your category generates 100,000 brand searches a month and 12,000 of them are for your brand, your share of search is 12%. In practice you’re not working with absolute volumes, Google Trends gives you an index, not raw counts. One term always peaks at 100; everything else is relative to that peak. The workaround: export all your comparison terms together, then calculate each brand’s proportion of the sum of all index values. Fifteen minutes in a spreadsheet once you’ve done it once.
Hankins recommends applying a 6 to 12 month rolling average to smooth the data. Calculate a rolling average across all brands you’re tracking, total it, then divide each brand’s rolling average by that sum and express it as a percentage. That irons out seasonality and turns a reactive squiggle into something resembling a mid-to-long-term trajectory.
What you’re looking for isn’t a single number, it’s a trend. A flat or slowly rising line might look fine until you notice a competitor’s line climbing faster. A sudden spike deserves investigation before celebration. A product recall can spike search volume. So can a PR crisis. High searches don’t always mean high intent to buy.
Extra Share of Search (ESOS), the Signal Inside the Signal
Hankins and Binet identified a refinement worth knowing: the gap between your share of search and your actual market share. When your SoS runs higher than your current market share would predict, demand is accumulating ahead of purchase, people are aware and curious, they just haven’t bought yet. That’s pipeline. When your market share is higher than your search share, you’re running on installed base momentum. Brand-building may be falling behind retention. You’re living off existing customers more than earning new ones.
One important clarification: the correlation between SoS and market share does not mean search drives sales directly. The relationship is bidirectional, growing brand awareness generates more searches, and more searches reflect growing brand awareness. It’s a signal, not a dial you can turn.
Why Share of Search Makes Sense as a ZMOT Scoreboard
Google introduced the Zero Moment of Truth (ZMOT) in 2011 to describe the moment when a person, after receiving a stimulus, searches online for information to decide whether to buy, before ever interacting with the product or speaking with a salesperson. The research that happens before the shopper even reaches the shelf, through reviews, comparisons, and other people’s opinions, is where brand perception forms, long before purchase.
Share of search is, in effect, a scoreboard for ZMOT. Every time someone searches your brand name at the zero moment, before they’ve talked to sales, before they’ve visited your site, possibly before they’ve even decided they’re going to buy, that search registers. Your SoS measures how often your brand is the one being researched at that critical pre-purchase window, relative to every other option in the category.
This is why branded search is more meaningful than general category search for measuring brand strength. A search for ‘Salesforce CRM’ and a search for ‘what is CRM software’ represent very different moments in a buying journey. Share of search tracks the former, the high-intent, you’re-on-the-shortlist signal. And even if someone hears about your brand by word-of-mouth, they’ll almost certainly search your name before making a decision. Every touchpoint that creates awareness, a podcast appearance, a PR mention, a referral from a happy customer, ultimately shows up in branded search volume if it worked at scale. Share of search aggregates all of that upstream influence into one observable, repeatable number.
Putting this to work? The ideas in the Canon are the foundation under the tactical playbook in Build a Complete Marketing Department — grab the free companion kit at mmsvegas.com/resources.
Where Share of Search Works Best, and How to Apply It Today
Share of search works best where people search for brands by name before buying, automotive, electronics, telecoms, professional services (law firms, accountants, marketing agencies), SaaS products, financial services, healthcare providers, and home services. Anywhere that a considered decision precedes purchase, and where the buyer is likely to Google your brand name during their research, the signal is meaningful.
For an operator running a regional HVAC company, a SaaS startup competing against three or four established players, or a professional services firm trying to understand whether their content investment is building brand awareness, share of search gives you something you couldn’t buy cheaply before: a directional reading of competitive momentum, updated weekly, free.
Because share of search isn’t based on advertising spend, it applies to operators who rely more on relationships, content, and referrals than on media buys. You can still benchmark your momentum against competitors who are buying awareness the traditional way, without needing to know what they’re spending.
Practical Uses Beyond Brand Health
A rising competitor’s SoS often signals marketing or product moves worth investigating before the lost deals show up in your pipeline. Monitoring which brand names are trending upward also helps identify emerging players, a competitor whose search volume is climbing fast but whose product hasn’t yet earned market share is a competitive threat arriving months early. That’s genuinely useful intelligence.
You can also use share of search to test whether offline investments are translating into brand awareness. Sponsor a local event, run a radio campaign, land a significant press placement, you should see a measurable bump in branded search volume in the days and weeks following. If you don’t, the reach was probably narrower than the price tag implied. Free reality check, available immediately after the campaign wraps.
Seasonality is also readable. Pull two to three years of SoS data and you’ll start to see the natural rhythm of your category, when demand builds, when it fades, and whether your share within that rhythm is growing or eroding. Useful for budget allocation decisions, and for not panicking in the slow months when everyone’s share drops together.
When to Skip Share of Search Entirely
The 83% correlation figure gets cited constantly. What gets cited less is the caveat attached to it: the ratio between share of search and share of market varies by category and country. In some categories the correlation is strong. In others it’s essentially noise. Knowing which side your business sits on matters before you build a quarterly reporting system around this metric.
Share of search is less reliable for very low-involvement products rarely searched by brand name, for brands with ambiguous names that generate irrelevant searches, and in niche B2B markets with volumes too low to produce stable data. If your product is a commodity impulse purchase, someone grabs it off a shelf without searching first, branded search volume doesn’t enter the decision at all.
Common situations where SoS is difficult or impossible to rely on: brands with wide product portfolios covering multiple verticals; brands whose names are difficult to spell, have variations or nicknames, or whose names overlap with other common words or categories; and brands in very niche markets with low search volume. If Google Trends returns no data or misidentifies your brand, either upgrade to a paid keyword tool or accept that SoS isn’t the right instrument here.
There’s also a practical floor problem. Google Trends mainly provides data on branded searches for established websites, if your monthly traffic is relatively low, Trends won’t show anything. That doesn’t mean your brand is invisible; it means your volume is below the threshold Google’s index captures.
Generic brand names create a separate headache. A company called ‘Eastern’ or ‘Pilot’ or ‘Summit’ is going to find its search data hopelessly polluted with unrelated queries. You’ll know immediately, the trend lines won’t match anything observable in the real world.
One more honest limitation: the findings refer to correlations, not causal relationships. A spike in searches for your brand after a PR crisis looks identical to a spike from successful advertising. The number alone doesn’t tell you which is which. You need context, and that context still lives with you.
How to Measure Share of Search, A Practical Operator’s Setup
Here’s the setup that takes about an hour to build and twenty minutes per quarter to maintain.
Step 1: Define your competitive set. Pick three to five direct competitors, brands a buyer genuinely considers when they consider you. Not the category giants if you’re a regional player; the ones who actually appear on your clients’ shortlists. Exclude marketplaces like Amazon or review sites, since they drive sales for multiple brands at once and don’t represent a single competitor.
Step 2: Pull Google Trends data. Open Google Trends, enter your brand name and each competitor’s name as separate comparison terms. Track only the country you sell in, or the countries that generate the most sales. Set a 12-month or multi-year date range and export the CSV.
Step 3: Build your SoS calculation. In a spreadsheet, sum each brand’s index values for each time period. Divide each brand’s total by the sum of all brands. That percentage is each brand’s share of search. Track it quarterly using a rolling 12-month average to iron out seasonality.
Step 4: Interpret trends, not snapshots. A single reading means little. You’re looking for directional movement over at least two or three quarters. Share of search is measuring long-run brand-building, not short-term campaign performance. Checking it weekly like you might check sales figures is counterproductive.
When Google Trends isn’t enough. If you have a large competitor set, or want more certainty about brand search volume despite having a less ownable name, supplement with data from tools like Ahrefs or SEMrush. These provide absolute volume estimates that make cross-brand comparison more reliable, at the cost of a paid subscription. For most operators, Google Trends is sufficient to identify directional trends.
Once you have your baseline, the practical question is: what moves it? The answer is anything that builds awareness, digital PR that secures media placements, podcast appearances, speaking engagements, earned press, content that travels. All of it shows up in branded search if it worked at scale. Direct mail, in-person networking, and referral programs often don’t register directly in search terms but absolutely drive purchase. Share of search captures the awareness layer, not every growth lever.
Common Misunderstandings About Share of Search
Misunderstanding 1: More searches means more revenue. The correlation between SoS and market share is strong at a population level and over time, it doesn’t mean next month’s revenue tracks your search volume line. Brand desirability, offer quality, pricing, conversion experience, all of these sit between awareness and revenue. SoS can’t tell you which of those is the bottleneck.
Misunderstanding 2: A spike is always good news. Tesla’s share of search bumped in late 2023 and again in mid-2024, the second peak driven not by a successful campaign, but by recalls drawing attention to the Cybertruck. Negative attention drives searches. So does a competitor going out of business. Before you report a spike upward, ask what happened in the world that week.
Misunderstanding 3: Share of search is an SEO metric. It isn’t. Your SEO ranking determines where you appear when someone searches your brand name. Share of search measures whether they’re searching it at all. Related, but not the same. SoS is a brand metric, not a traffic metric.
Misunderstanding 4: You need to be a big brand for it to work. The research has concentrated on large consumer categories, but there’s no reason it couldn’t apply to local businesses or B2B, provided the category has enough branded search volume to register. A regional law firm, a mid-market SaaS product, or a specialty food brand competing in a definable category can run this analysis just as meaningfully as a national brand.
Misunderstanding 5: Rising SoS is proof your marketing is working. It’s evidence, not proof. Share of search tells you the output is moving. It doesn’t tell you which input caused it. That attribution work still lives with you.
Common Mistakes
- Tracking absolute search volume instead of relative share — A real failure mode: operators export their own branded search volume from Google Search Console, see it rising, and declare brand momentum, without ever comparing it against competitors. Overall category search rises and falls with seasonality and market size. Your volume going up while your share goes down is a slow-moving loss, and absolute numbers hide it entirely. Always divide your search index by the sum of all competitors’ indexes.
- Acting on a single-week spike without context — A spike that looks like a campaign win is sometimes a recall, a competitor crisis, or a Reddit thread gone viral. Operators who report a sudden SoS jump as proof of marketing success, without checking what happened in the world that week, end up defending a number that has nothing to do with their work. Use a rolling 12-month average and wait for sustained directional movement across at least two to three consecutive quarters before drawing conclusions or shifting budget.
- Padding the competitor set with brands that aren’t real alternatives — Including category giants, marketplace aggregators, or adjacent brands that your buyers don’t actually consider inflates the denominator and makes your share look artificially small. The competitive set needs to match your real shortlist, the three to five names that appear alongside yours when a prospect is deciding. Get that wrong and every subsequent reading is distorted.
- Attributing a SoS increase to a specific campaign without cross-referencing external events — Operators running their first serious brand campaign often point to a rising SoS trend as proof it worked. Sometimes it did. Sometimes a competitor had a bad quarter, or a piece of press landed that had nothing to do with the campaign. The attribution discipline, checking external events before claiming credit, is yours to maintain. The metric can’t do that work for you.
- Applying SoS to a category where it structurally can’t function — Running share of search for a business-to-business company selling a proprietary process to twelve enterprise clients, or for a brand whose name is also a common dictionary word, doesn’t produce a signal, it produces noise that looks like a signal. Operators who build quarterly reporting around SoS without first confirming the category has sufficient branded search volume end up making decisions from meaningless data. Test before you track: if Google Trends returns no data or confuses your brand with unrelated queries, use win-loss analysis and direct customer research instead.
Operator’s Take
Most operators who try share of search make the same mistake: they run it once, feel something about the number, and never look at it again. That’s not a measurement discipline, that’s a curiosity. The metric only pays off when it becomes a recurring habit with a defined response protocol. Here’s how to build that.
Start by picking the right competitive set, and being honest about it. Not the brands you aspire to compete with. The three or four names that actually show up on your prospects’ shortlists. If you’re a boutique accountancy in Manchester, you’re not benchmarking against Deloitte. You’re benchmarking against the two or three regional firms your clients mention when they’re deciding. Get the competitor set wrong and every reading that follows is measuring the wrong race.
Once you have a baseline, the most actionable number isn’t your share, it’s the trend direction of each competitor relative to yours. Build a simple dashboard in Google Sheets: four columns for brand names, one column for each quarter’s rolling share percentage, a sparkline for each. Update it quarterly. That’s it. The value isn’t the dashboard, it’s the conversation it forces. A competitor whose share has risen three points in two quarters is doing something worth understanding before you lose the deal you didn’t know you were losing.
Second use, and one operators almost always skip: campaign reality check. Any time you run an offline investment, a sponsorship, a PR push, a speaking series, a sustained podcast run, pull your branded search trend for four weeks before and four weeks after. If the campaign reached real people at meaningful scale, you’ll see a bump. If you don’t, the reach was probably narrower than whoever sold you the campaign claimed. This matters most when you’re justifying brand spend to a partner, a board, or yourself. Share of search gives you a fast, cheap read on whether the awareness actually moved, no survey required, no research firm invoice.
Third, watch the ESOS gap actively, not just as an observation but as a decision trigger. If your SoS is running materially ahead of your market share, you have accumulated demand that hasn’t converted. The right response isn’t more awareness spend. It’s tightening your conversion path: better onboarding, faster sales follow-up, sharper proposals. The top-of-funnel is working. The middle isn’t. If your market share is outrunning your SoS, you’re coasting on existing customers, and the question isn’t whether the problem will arrive, it’s when. That’s when you shift budget toward brand-building, not performance channels, even if the performance channels are showing fine return in isolation.
One more thing worth saying plainly: share of search won’t replace a win-loss analysis or customer interviews. It tells you something is moving. It doesn’t tell you why. A sliding SoS might mean a competitor launched a better product, ran a brilliant campaign, or got a glowing write-up in a trade publication you don’t read. The signal points you at the right question. Getting the answer still requires picking up the phone and asking your lost customers what happened. Use both. They answer different questions.
Where to skip it entirely: very niche B2B with low search volume, commodity purchases that don’t involve brand-name searching, and any situation where your brand name is a common English word. If Google Trends can’t distinguish you from the general vocabulary, the numbers are meaningless. Don’t build reporting around noise.
Used in
- ✓ Build a Complete Marketing Department
Used as a directional brand health checkpoint, operators track SoS quarterly alongside conversion and revenue metrics to distinguish brand-building investment from direct-response results, and to spot competitive momentum shifts before they appear in pipeline. - ✓ The Missing Manual for FunnelKit
Referenced when diagnosing top-of-funnel awareness gaps, if branded search volume is flat or declining while paid traffic holds, it indicates the funnel is capturing existing demand rather than building new brand recognition. - ✓ The Missing Manual for Make
Used to automate quarterly SoS reporting, pulling Google Trends exports via scheduled workflows, calculating rolling share percentages in Google Sheets, and flagging directional changes above a threshold for operator review.
FAQ
How is share of search different from share of voice?
Share of voice measures how much of a category’s total advertising spend your brand owns, it’s an input metric. Share of search measures the branded search queries your brand actually receives relative to competitors, it’s a behavioural output. Share of voice requires knowing competitors’ media budgets, which is often impossible. Share of search is observable for free, updated weekly, and reflects actual buyer behaviour rather than spending patterns.
Can a small or local business use share of search?
Yes, with one important precondition. The category needs enough branded search volume for Google Trends to register data. A regional law firm or a specialty SaaS product competing against named rivals can run this analysis meaningfully. Where it falls apart: search volumes too low for Google’s index to capture, or brand names that are common words. If Trends returns nothing, try a paid tool like Ahrefs or SEMrush for absolute volume estimates. If those also come up empty, the category probably doesn’t have sufficient search behaviour for SoS to be useful, win-loss interviews will tell you more.
How often should I check my share of search?
Quarterly, using a rolling 12-month average. Daily or weekly checks generate noise, not insight, SoS reflects long-run brand trends, not campaign-level swings. The rhythm that works: pull the data once a quarter, update your rolling average, and look for directional movement. If something moves sharply between readings, investigate the cause before changing anything.
Does a spike in branded searches always mean something positive?
Not at all. Negative press, product recalls, competitor collapses, and even viral criticism can all drive branded search spikes. The number tells you volume changed, it doesn’t tell you why. Always cross-reference a sudden jump with external events before claiming credit. The medium-term trend across multiple quarters is far more reliable than any individual spike.
Is the 83% correlation between SoS and market share reliable for my business?
Treat it as a cross-category average, not a guarantee. The figure comes from Hankins’ IPA think tank research presented at IPA EffWorks Global 2021, drawing on 30 case studies across 12 categories and seven countries, and the researchers were explicit that the findings refer to correlations, not causal relationships, and that the ratio varies by category. For your specific market, run your own comparison for at least 12 months, checking SoS trends against whatever market share signals you have access to. If the two move together consistently, you have a useful proxy. If they don’t, adjust accordingly.
What tools do I need beyond Google Trends?
Google Trends handles the basic setup for free and covers most operators’ needs. Where it falls short: generic brand names, large competitor sets, or situations where you need absolute volume rather than indexed values. In those cases, Ahrefs, SEMrush, or Serpstat provide more reliable data at a monthly subscription cost. Start with Trends, upgrade only if you hit a clear limitation.
Further reading
- Les Binet, ‘Share of Search as a Predictive Measure,’ IPA EffWorks Global 2020: The original presentation that introduced the metric. The slide deck and video are freely available via the IPA’s EffWorks pages at ipa.co.uk. Start here before reading anything else on the subject.
- James Hankins, ‘Share of Search: One Year On,’ IPA EffWorks Global 2021: The follow-on research across 30 case studies in 12 categories and seven countries that produced the 83% market-share correlation figure. Key findings available at ipa.co.uk. Read alongside Binet’s original to understand both the strength and the limits of the finding.
- IPA Share of Search Think Tank findings, reported by Marketing Week (October 2021): A clear published summary of Hankins’ 2021 findings, with the 83% figure in context and key caveats intact. Available at marketingweek.com.
- Les Binet & Peter Field, Effectiveness in Context (2018): The broader effectiveness framework that contextualises share of search within the brand-building vs. activation debate, useful for operators who want to understand why brand metrics matter alongside performance metrics.
Sources: Les Binet / IPA EffWorks Global 2020 Conference presentation, ‘Share of Search as a Predictive Measure,’ 14 October 2020 (ipa.co.uk); James Hankins / IPA Share of Search Think Tank, ‘Share of Search: One Year On,’ IPA EffWorks Global 2021, 12 October 2021 (ipa.co.uk); IPA press release, ‘New findings from the cross-industry IPA Share of Search think tank data,’ 12 October 2021 (ipa.co.uk); Marketing Week, ‘Share of search represents 83% of a brand’s market share, think tank finds,’ 12 October 2021 (marketingweek.com); LBBOnline, ‘Les Binet Unveils Share of Search Metric with 10 Key Findings,’ 14 October 2020; LBBOnline, ‘IPA Share of Search Data Reveals SoS Represents 83% of a Brand’s Share of Market on Average,’ 12 October 2021; Deep Marketing, ‘Share of Search: the Free Predictor of Market Share’ (2026); Branquo, ‘The Ultimate Guide to Share of Search’ (2026); Objective Platform, ‘Share of Search: A Better Way to Measure Brand Health’ (2026); Shopify Blog, ‘Share of Search: How to Calculate and Improve It’ (2026); Search Engine Land, ‘Share of search: Measure your brand’s visibility in the SERPs’ (2025).
Brian Kasday spent forty years in direct-response marketing before rebuilding the whole operation as a one-person shop. He writes The Operator’s Library — including “Build a Complete Marketing Department” — for operators who’d rather build it themselves than wait on someone else.
Build the department these ideas describe — the free companion kit: mmsvegas.com/resources.
More The Operator's Canon guides
Free · Operator Toolkit
Want the tools, not just the guide?
Get the free operator toolkit — templates and checklists for the systems you actually run, plus a note when this guide changes.
Get the free toolkit →How to cite: Share of Search. Associated with Les Binet & James Hankins, 2020. The Operator’s Canon, MMS Vegas. https://mmsvegas.com/library/share-of-search-explained/