
Last updated: September 2026
Net Promoter Score is probably the most widely used, and most confidently misunderstood, metric in customer experience. By the end of this page, you’ll know exactly which decisions NPS can support, which ones it can’t, and how to run a program that actually changes your business instead of just producing a quarterly slide.
The pitch is seductive: ask one question, get one number, understand your growth trajectory. Fred Reichheld introduced it in a 2003 Harvard Business Review article titled “The One Number You Need to Grow,” and the marketing gods smiled. At least two-thirds of the Fortune 1000 went on to adopt it, by Fortune’s own count in 2020. It became the default CX metric for boardrooms, QBRs, and investor decks worldwide.
For a small-business operator, that backstory is interesting but not really the point. The point is: does tracking this thing help you make better decisions about your customers, your team, and your retention? The answer is yes, conditionally. NPS gives you a directional read on loyalty and a structured reason to have conversations you’d otherwise skip. What it doesn’t give you is a guarantee of growth, a substitute for revenue data, or anything reliable if you let the score get gamed. Know the difference, and NPS earns its place. Ignore it, and you end up optimizing for a number while your best customers quietly leave.
The idea in 30 seconds
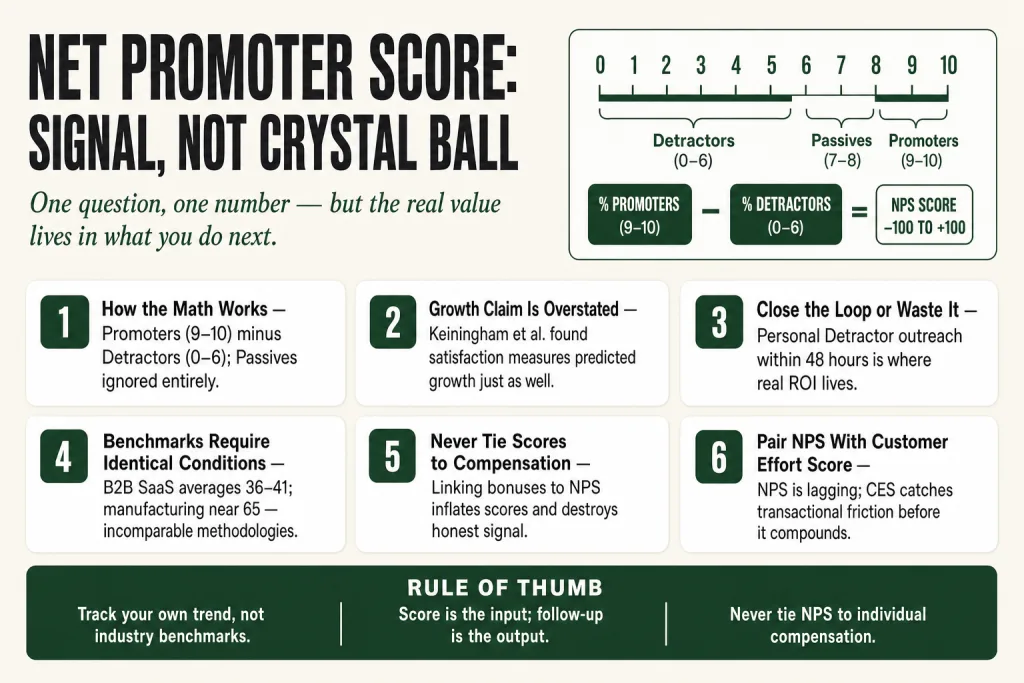
- One question, one number: Ask customers how likely they are to recommend you on a 0 to 10 scale. Subtract the percentage of Detractors (0 to 6) from Promoters (9 to 10). That’s your NPS, ranging from −100 to +100.
- Useful signal, not a crystal ball: NPS is a decent read on relationship health at a point in time, it does not reliably predict revenue growth on its own, despite the original claim.
- The score is almost beside the point: The conversation after the survey, the follow-up with Detractors, the referral ask with Promoters, is where real value lives.
- Benchmarks require context: Industry medians range from under 30 to 65+, depending on industry and measurement method; comparing your score to a different industry or survey approach is noise dressed as insight.
- Gaming destroys the tool: Tying NPS to front-line compensation is the single fastest way to inflate your score and lose all signal. Reichheld himself has said so, repeatedly.
- Pair it, don’t worship it: NPS works best alongside Customer Effort Score (for transactional friction) and Customer Health Score (for expansion and churn risk).
Where Net Promoter Score Came From
Fred Reichheld had spent years studying customer loyalty at Bain & Company when he noticed a mismatch: long, elaborate satisfaction surveys weren’t telling companies anything useful about growth. He tested a handful of questions against actual customer behavior and found that one, How likely is it that you would recommend us to a friend or colleague?correlated most consistently with what customers actually did.
He published the finding in December 2003 in the Harvard Business Review. The formula: take the percentage of customers scoring 9 to 10 (Promoters), subtract the percentage scoring 0 to 6 (Detractors), ignore the 7 to 8s (Passives), and you land between −100 and +100. Reichheld made the methodology open-source, no licensing fees, which accelerated adoption faster than any consulting arrangement could have. A full book, The Ultimate Questionfollowed in 2006, with a revised edition in 2011 that rebranded NPS as a full management system rather than just a metric.
NPS is a registered trademark of Bain & Company, Satmetrix Systems, and Fred Reichheld. The trademark protects the methodology from distortion, not from adoption. That’s the short version, what matters for running a business is what the score can and can’t do in practice, which is what the rest of this page covers.
How the Net Promoter Score Calculation Actually Works
The mechanics are genuinely simple, which is part of the appeal. You send customers a survey with one rated question, the recommendation likelihood question on a 0 to 10 scale, and usually one open-ended follow-up asking why they gave that score. Then:
- Promoters score 9 or 10. They’re enthusiastic enough to put their own reputation behind a referral.
- Passives score 7 or 8. Satisfied but not loyal. Vulnerable to a better offer from a competitor. They don’t help your score and they don’t hurt it, they’re just ignored in the formula.
- Detractors score 0 through 6. They’re unhappy, and some percentage of them are actively telling people.
NPS = % Promoters − % Detractors. If 60% of your respondents are Promoters and 20% are Detractors, your NPS is 40.
One quirk worth understanding: the formula discards the Passives entirely. That creates a counterintuitive result, a company with 30% Promoters and 30% Detractors scores zero, but so does a company with 50% Promoters and 50% Detractors. Same score, completely different customer profile. The aggregate number hides distribution information that matters operationally.
There are two flavors of NPS worth distinguishing:
- Relationship NPSsent periodically (quarterly or annually) to the full customer base. Asks how they feel about the company overall. This is the strategic pulse-check.
- Transactional NPStriggered after a specific event: a support interaction, a delivery, an onboarding session. Asks how they feel about that experience. This is the operational diagnostic.
Most small operators start with relationship NPS because it’s simpler to run. Transactional NPS is where the most actionable signal often lives, but it requires more survey infrastructure. Both are useful; they answer different questions.
What Net Promoter Score Can, and Cannot, Reliably Predict
The original claim was bold: NPS is the single best predictor of revenue growth. Track the number, drive it up, and growth follows. Clean, causal, convincing.
The academic response was skeptical. Keiningham, Cooil, Andreassen, and Aksoy published a study in the Journal of Marketing in July 2007, winner of the Marketing Science Institute/H. Paul Root Award, that attempted to replicate Reichheld’s findings across multiple industries. Their conclusion: traditional customer satisfaction measures predicted growth just as well, sometimes better, and NPS “cannot be called the better predictor of growth” for the industries they examined. A separate 2023 Marketing Science Institute working paper by Lundmark, Krosnick, and colleagues, using Bayesian regression trees on data from over 30 U.S. companies, found no support for the claim that NPS predicts revenue growth across their sample either.
Keiningham’s team also flagged a methodological issue: when they ran the same correlation approach systematically, the NPS advantage over other satisfaction measures disappeared. The research picture since then has stayed mixed, some studies find a connection to sales growth under specific conditions, others don’t, but the confident, universal claim in Reichheld’s original title has never been substantiated in peer-reviewed literature.
There’s also a structural issue with NPS as a predictive tool. It’s attitudinal, it measures what customers say they’d probably do, not what they actually do. Stated intentions are a reasonable proxy for present sentiment, but a noisy proxy for future behavior. Someone who scores you a 9 might never refer anyone; someone who scores you a 6 might refer their entire network after a service recovery. And separately, Keiningham et al.’s research showed that CX metrics like NPS, satisfaction, and purchase intention collectively explain less than 1% of the variance in customers’ share of wallet, which should recalibrate how much predictive weight any single attitudinal metric carries.
What NPS does predict reasonably well, at the directional level, is current relationship health. A sustained drop over three or four periods is a meaningful signal that something has changed, in your service, your product, your pricing, or your market position. A sustained rise is evidence that whatever you changed is landing. But a single number in a single period tells you very little. And cross-industry or cross-methodology comparisons are almost meaningless, a SaaS NPS of 40 and a manufacturing NPS of 40 describe completely different customer relationships, measured differently, against different expectations.
Use NPS as a directional metric against your own history. Don’t use it to forecast next quarter’s revenue. Don’t use it to impress investors with a number that isn’t grounded in a consistent methodology. And read the verbatim comments, those are where the real diagnostic value lives.
Benchmarks: What the Numbers Mean in Context
Benchmarks exist, and they’re useful for rough orientation, but they carry significant interpretation risk if you use them carelessly.
Retently and a number of other survey vendors publish industry NPS benchmarks, and they are useful for rough orientation only. Published medians vary widely from one vendor to the next, and that spread reflects different methodologies and sample compositions more than it reflects real differences in performance. The one pattern that holds across sources is directional rather than numeric: B2C averages run higher than B2B. Treat any single published benchmark as one vendor’s customer base rather than as an industry figure, and do not set a target off it.
The Qualtrics XM Institute’s 2024 U.S. consumer benchmark study surveyed 10,000 U.S. consumers across 354 companies and 22 industries. In that dataset, which uses a consumer-facing methodology, the spread across industries was more than 18 points between the top and bottom performers. Notably, those consumer NPS figures run substantially lower than B2B-focused benchmark studies, illustrating exactly why cross-study comparisons break down quickly.
Here’s the problem with any benchmark: the numbers come from different survey methods, sampling approaches, timing, and question contexts. An NPS study is comparable to another only when the market, date, population, and question framing are sufficiently similar. If you read a number from a vendor whitepaper and compare it to your own score from a different platform with different delivery timing, you’re comparing apples to something that isn’t fruit.
The more honest benchmark is your own trend line. Is your score moving up or down over 6 to 12 months? Are specific customer segments declining while others hold? Is your Detractor percentage growing even when your overall score stays flat? Those internal comparisons give you something to act on. The industry number gives you conversational context at best.
One specific note on the math: a score of zero isn’t neutral. It means your Promoters and Detractors are perfectly canceling each other out, a problem in any business that depends on referrals or repeat revenue. Any score below zero should be treated as urgent, regardless of what the industry median says.
Putting this to work? The ideas in the Canon are the foundation under the tactical playbook in Build a Complete Marketing Department — grab the free companion kit at mmsvegas.com/resources.
Where Net Promoter Score Still Earns Its Place
For all the academic pushback, NPS survives because it solves a real operational problem: getting customer feedback into the hands of people who can act on it, at a frequency that’s actually sustainable. Long CSAT surveys get low completion rates. Qualitative interviews are expensive. NPS is a one-question survey that most customers will answer in thirty seconds, and the follow-up question, why did you give that score? produces verbatim feedback that no algorithm has to invent.
The cases where NPS earns clear ROI for a small operator:
Subscription and recurring-revenue businesses
When your revenue depends on renewals, NPS is an early-warning system. A Detractor score isn’t just a loyalty signal, it’s a churn risk flag. You now know to call that account before the renewal conversation becomes a cancellation conversation. This is the scenario where the score most directly converts into a business action with a measurable dollar value attached.
Businesses dependent on referrals
If word-of-mouth is a meaningful acquisition channel for you, and for most local service businesses and professional practices, it’s the dominant one, then knowing who your Promoters are is commercially valuable. Promoters don’t just score you well; they’re the population most likely to give a testimonial, accept a referral program invitation, or take a LinkedIn endorsement request. NPS gives you a principled way to identify and activate that group.
Post-service-recovery situations
Running a transactional NPS survey after a service failure, after you’ve addressed it, tells you whether the recovery landed. This connects directly to the Service Recovery Paradox: customers who experience a failure that’s resolved well often end up more loyal than customers who never experienced a problem. NPS can quantify whether your recovery process is achieving that effect, or whether it’s leaving people in Passive territory when they should be moving back to Promoter.
Tracking the impact of operational changes
Changed your onboarding process? Hired a new service team? Launched a new product? Running NPS before and after gives you a directional read on whether the change improved relationship quality. It’s not a controlled experiment, but it’s a structured signal, and for a small operator, that’s often enough.
Where Net Promoter Score Falls Short
NPS has a few genuine structural weaknesses, and pretending they don’t exist is how operators end up making bad decisions with misplaced confidence.
It tells you what, not why
A score of 32 doesn’t tell you whether the problem is your product, your pricing, your support, your billing process, or the fact that one rep on your team is consistently rude. The follow-up question helps, but only if respondents answer it with enough specificity, and many don’t. NPS identifies that a problem exists; it almost never diagnoses the cause with enough precision to drive a fix.
It’s a lagging indicator
NPS reflects the cumulative result of many interactions over time. By the time a significant NPS decline shows up in your quarterly survey, the underlying problem has usually been compounding for months. Transactional metrics like Customer Effort Score are better at catching friction at the moment it happens, which is why Customer Health Score programs that combine multiple signals catch churn risk earlier than NPS alone.
It ignores the Passives, and that’s a mistake at scale
Your 7s and 8s don’t move your score, which makes them easy to skip. That’s a mistake. A customer who scores you a 7 is satisfied enough to stay quiet, but not loyal enough to stay put if a competitor offers something marginally better. In a business with meaningful churn risk, a large Passive population deserves attention that the standard NPS formula won’t prompt you to give them.
Low response rates create selection bias
If only 15% of your customers respond to your NPS survey, you don’t have a representative sample, you have a self-selected group motivated enough to express an opinion. Promoters and Detractors tend to respond at higher rates than Passives. This systematically inflates the score’s extremes and makes trend comparisons unreliable if your response rate changes between surveys.
It doesn’t capture the relationship between score and revenue
A Detractor spending $50,000 a year with you is a completely different priority than a Detractor spending $500. NPS treats them identically. Any serious retention program needs to weight scores by account value, otherwise you’re allocating recovery effort to accounts that don’t justify it while higher-value relationships quietly deteriorate.
Common Misunderstandings About How Net Promoter Score Works
Some of the confusion around NPS isn’t about execution, it’s about what the concept means in the first place. These are the conceptual errors that lead operators into the wrong program design before they’ve even started.
“A high NPS means our customers are loyal.”
Not exactly. A high NPS means a meaningful share of your surveyed customers said they’d probably recommend you. That’s correlated with loyalty, not equivalent to it. Customers can score you a 9 and then leave six months later for a competitor who made a better offer. Loyalty is a behavioral pattern, repeat purchase, renewal, referral, not a stated intention. NPS is a reasonable proxy for the attitude that tends to produce loyalty; it’s not loyalty itself.
“Our NPS of 45 means we’re better than the industry.”
Only if you’re comparing against surveys with the same methodology, timing, sampling frame, and question wording in your specific industry. A benchmarking comparison that doesn’t control for those variables is closer to a horoscope than a data point. The benchmark number is useful for rough context, not precision comparisons.
“NPS predicts growth.”
This is the original claim, and it’s been substantially qualified. Keiningham et al. (2007) in the Journal of Marketing found that satisfaction measures predicted growth just as well, NPS held no consistent advantage. A 2023 Marketing Science Institute working paper by Lundmark, Krosnick, and colleagues reached the same conclusion across data from more than 30 U.S. companies. NPS can correlate with growth in businesses where word-of-mouth is a primary acquisition driver, but the correlation isn’t consistent enough across industries to use as a reliable growth forecast. It’s a loyalty signal, not a revenue model.
“We should survey everyone at once.”
Batch surveys, sending the same NPS email to your entire list on the same day, create a snapshot in time that’s prone to event contamination. If you had a billing problem or a product outage the week before your survey, the scores will reflect that, not your underlying relationship health. Triggered surveys tied to individual customer milestones (anniversary, post-support, post-onboarding) produce cleaner, more actionable data.
“Improving our NPS score is the goal.”
The score is a measurement, not an outcome. Improving the customer experience is the goal; NPS is one way to check if you’re succeeding. When teams optimize for the number itself, coaching customers on what a 10 means, surveying selectively, timing surveys after unusually good interactions, they raise the score without improving the experience. This is Goodhart’s Law at work, and it’s exactly how NPS programs collapse into useless noise. See: Goodhart’s Law Explained.
Running a Net Promoter Score Program That’s Worth the Effort
The mechanics of sending a survey are easy. The part that makes NPS valuable, or wastes everyone’s time, is what happens after the score comes in. Here’s what a functional operator-level NPS program looks like.
Survey design and timing
Use the standard question verbatim: “On a scale of 0 to 10, how likely are you to recommend [company name] to a friend or colleague?” Then add one open-ended follow-up: “What’s the main reason for your score?” That second question is where the diagnostic value lives. Without it, you have a number with no context.
Send NPS surveys at meaningful moments, after onboarding completion, at the six-month mark in a subscription, after a significant support resolution, at annual renewal. Triggered surveys tied to customer events produce better response rates and cleaner data than mass batch sends. Keep the survey short. Two questions is enough. Three is the maximum before completion rates drop.
Closing the loop, the part most operators skip
Closing the loop means following up with customers after their survey response. For Detractors, this isn’t optional if you care about retention. Best practice is a personal outreach within 48 hours, not an automated email, a real conversation. The goal is to understand what went wrong and, where possible, fix it. Customers who experience a genuine recovery often become more loyal than customers who never had a problem in the first place.
For Promoters, closing the loop means thanking them and, where appropriate, making a specific ask, a referral, a review, a testimonial. Promoters are already primed to help you; most operators just never ask. That’s a referral program sitting dormant in your survey results.
Passives deserve acknowledgment too. A brief follow-up asking what would improve their experience can surface actionable issues that never show up in Detractor feedback, because Passives are polite enough not to complain, but disengaged enough to leave quietly.
Weighting scores by account value
Segment your NPS results by revenue tier. A Detractor in your top 20% of accounts by revenue is a fire to put out this week. A Detractor in your bottom 20% is still worth understanding, but the recovery prioritization is different. Treating all Detractors identically is the fastest route to misallocating your customer success effort.
Tracking trend, not just number
Run your NPS on a consistent cadence, quarterly for relationship NPS is a common starting point, and track the directional movement over time. Plot Promoter percentage and Detractor percentage separately, not just the net score. A stable NPS made up of a declining Promoter share masked by a declining Detractor share is a very different situation than the same score held steady by genuine consistency. The component breakdown tells the real story.
Keeping the methodology consistent
Change your survey timing, switch platforms, or alter the question wording, and your trend data becomes incomparable. Measurement consistency matters more than measurement perfection. Pick a method and stick with it long enough to see actual trends, at minimum four to six periods before drawing conclusions.
NPS vs. Customer Effort Score: Knowing Which Question to Ask
Customer Effort Score (CES) was introduced in 2010 by researchers at the Corporate Executive Board (CEB, now Gartner). The core finding: reducing the effort customers have to expend to resolve an issue is a stronger driver of loyalty than creating exceptional, above-and-beyond experiences. The CES question asks customers how easy it was to accomplish their goal, on a scale typically from 1 to 7.
The original CEB research found that 96% of customers who had a high-effort service interaction became more disloyal, a figure that should recalibrate where any CX team points its spending. (That research is documented in Matthew Dixon, Nick Toman, and Rick DeLisi’s The Effortless Experience.) Adding delight at the top of the experience doesn’t move loyalty as much as removing friction at the bottom.
For an operator, the contrast between NPS and CES maps to a clear use-case split:
- Use NPS to measure overall relationship health, how customers feel about your company over time, after multiple interactions. It’s the right question for renewals, annual reviews, and understanding brand positioning.
- Use CES to measure specific transactional moments, after a support ticket, a billing dispute, an onboarding session. It catches friction in real time, before it compounds into a Detractor score six months later.
NPS is a lagging indicator; CES is a leading one. CES catches churn risk earlier. NPS gives you the longer view. The combination, relationship NPS on a regular cadence, transactional CES triggered after service touchpoints, gives you a more complete picture than either alone.
If you can only run one, and your business has significant service interaction volume, CES may give you more immediately actionable data. If your primary concern is understanding overall brand loyalty and referral propensity, NPS is the right tool. Most operators eventually want both.
Common Mistakes
- Treating the score as the deliverable — Before your next survey launches, name the person responsible for Detractor follow-up and the person responsible for Promoter activation. If you can’t name them, you’re not ready to run the program. A practical starting point: set up a simple Slack or email alert that fires every time a Detractor response comes in, routed directly to the account owner. No dashboard review required, it just shows up where the work happens.
- Tying NPS to front-line compensation — Automate survey delivery through your survey platform so no individual employee controls who gets surveyed or when. Remove NPS from individual bonus calculations entirely. If you want performance accountability tied to CX, use team-level trend movement over a rolling 12 months, long enough that gaming individual survey outcomes doesn’t move the number meaningfully.
- Running batch surveys instead of triggered ones — Set up triggers tied to specific journey milestones: post-onboarding, six-month subscription anniversary, post-support resolution, pre-renewal. Most CRMs and survey platforms support this with basic automation, in HubSpot, for example, a simple workflow tied to a contact property change is enough to get started. Pick one trigger, get it working, then layer in the next.
- Not closing the loop with Detractors — Set a 48-hour SLA for Detractor follow-up and assign a named owner per account segment. The follow-up must be personal, a direct call or email from someone with authority to actually resolve the issue, not an automated “we received your feedback” template. Track three numbers: percentage of Detractors contacted, median time to first response, and resolution rate. Those three tell you whether the closed-loop process is working or just existing on paper.
- Benchmarking against incompatible datasets — Compare your NPS against your own historical trend first, period over period, segment by segment. When you do use external benchmarks, confirm the methodology (relationship vs. transactional survey), market (B2B vs. B2C), and time period are genuinely comparable to your own measurement. If they aren’t, treat the number as directional orientation, not a target to close.
Operator’s Take
Most operators run NPS programs that are, charitably, decorative. The survey goes out. The score comes back. Someone puts it in a slide. Quarterly review happens. Nothing changes. The cycle repeats until someone cancels the platform subscription and no one notices for three months.
The failure isn’t the metric. It’s that operators treat the score as the output when it’s actually the input, the thing that tells you who to call, who to ask for a referral, and where your operation is quietly bleeding. Here’s where I’d actually put my attention.
Track loop closure rate, not response rate. Response rate is a vanity metric. What matters is what percentage of your Detractors got a real follow-up within 48 hours, and what percentage of your Promoters got a specific activation ask within a week. If you don’t know those numbers, your NPS program isn’t a retention tool, it’s a survey habit. Set those two as the operating metrics. Everything else is downstream.
Segment by revenue before you do anything else. A Detractor scoring you a 3 on a $120,000 annual contract is a five-alarm situation. A Detractor scoring you a 3 on a $400 account is worth a follow-up email, not a VP-level call. When you treat every Detractor response identically, you guarantee you’ll allocate recovery effort wrong, too much on accounts that don’t justify it, too little on the ones that do. Pull your Detractor list, sort it by ARR, and work top-down.
Build your Promoter list into your CRM like it’s a named sales territory. Those 9s and 10s are the closest thing you have to a warm referral pipeline that costs you nothing to generate. Most operators thank them in the survey confirmation email and move on. That’s leaving the easiest conversation you’ll ever have with a customer on the table. Tag every Promoter in your CRM, assign them to an owner, and make the ask specific: a Google review, a LinkedIn recommendation, a referral introduction to someone by name. Vague asks get vague results.
Read your Passive population as a leading churn indicator. The formula ignores 7s and 8s, which makes them easy to skip. But a growing Passive share, even with a stable overall NPS, often signals that you’re winning enough to keep customers from complaining while not winning enough to keep them from leaving. Ask Passives one thing: “What’s the one thing that would have made this a 9?” The answers are frequently more actionable than anything your Detractors tell you, because Passives haven’t given up on you yet.
Never tie NPS to compensation. The moment a bonus depends on a 9 or 10, your team will find ways to make that happen, selective survey timing, coaching customers on the scale, avoiding outreach with at-risk accounts before a send. The score climbs; the honest signal disappears. Automate delivery through your survey platform so no individual controls who gets surveyed or when, and keep the metric at the team and program level, not the individual performance review.
Cross-reference NPS against your actual retention data every quarter. A 58 NPS alongside 28% annual churn means something is broken in the translation from attitude to behavior, your Promoters aren’t staying, your survey isn’t representative, or the score is being gamed. NPS is the attitudinal read. Net revenue retention, renewal rates, and cohort curves are the behavioral record. When they diverge, trust the behavioral data and go find out why.
The AI tools worth putting to work here, automated survey delivery, triggered CRM tagging, Detractor alert routing, take the administrative load off. But they don’t replace the judgment calls: which Detractor gets a call today versus a templated email, whether a trend shift is real signal or a one-week anomaly, how hard to push a Promoter for a referral without turning a good relationship awkward. That part stays with you.
Used in
- ✓ Build a Complete Marketing Department
Used to establish a retention feedback loop within the marketing system, NPS identifies which customers to activate for referrals and which need recovery before churn. - ✓ The Missing Manual for FunnelKit
Applied as a post-purchase survey trigger to segment customers into Promoter, Passive, and Detractor workflows that drive different follow-up automations. - ✓ The Missing Manual for Make
Used to automate Detractor alert routing and closed-loop follow-up sequences so no scored response sits unanswered past the 48-hour recovery window.
FAQ
What is a good Net Promoter Score for a small business?
It depends heavily on your industry and how you’re measuring. Published vendor benchmarks differ enough from one another that no single figure is worth anchoring to, and most of them do not state their sample. More useful than any external number: is your own score trending up or down over 3 to 4 measurement periods? That trend tells you more than the absolute figure.
How often should I send an NPS survey?
For relationship NPS, a general pulse on how customers feel about your company, quarterly is a common cadence for small businesses. For transactional NPS tied to specific events like onboarding or support resolution, trigger the survey within 24 to 48 hours of the event. Don’t survey the same customer more frequently than once per quarter regardless of trigger type.
Should I tie NPS scores to employee bonuses?
No, and this is one of the few points where the research and the inventor of the metric agree. When front-line compensation depends on NPS, employees start gaming the survey: coaching customers on what to score, avoiding surveys for at-risk accounts, or outright asking for high ratings. The score inflates while the honest feedback disappears. Keep NPS out of individual performance pay.
Is NPS better than Customer Effort Score?
They measure different things at different stages. NPS captures overall relationship health and referral propensity over time, it’s strategic. Customer Effort Score captures how easy a specific interaction was, it’s transactional and tends to catch churn risk earlier. CEB research, summarized in <em>The Effortless Experience</em>found that 96% of customers who had a high-effort service interaction became more disloyal. Ideally, run both; if you have to choose one, pick based on whether your primary concern is relationship health (NPS) or service friction (CES).
What should I do when a customer gives a Detractor score?
Follow up within 48 hours, personally, not with an automated template. Acknowledge the feedback without being defensive. Ask what specifically went wrong. Where you can fix it, fix it and tell them what changed. This closed-loop process is where most of the actual ROI from NPS programs lives; it directly addresses churn risk and, done well, often moves Detractors back toward Passive or Promoter status.
Does a high NPS guarantee business growth?
No, and the academic research is clear on this. Keiningham et al.’s 2007 <em>Journal of Marketing</em> study found that traditional satisfaction measures predicted growth just as well as NPS, it held no consistent advantage. A 2023 Marketing Science Institute working paper by Lundmark, Krosnick, and colleagues found no support for NPS as a growth predictor across data from more than 30 U.S. companies. NPS correlates with word-of-mouth propensity, which matters in referral-driven businesses, but it’s not a reliable standalone growth forecast. Always read it alongside actual behavioral data: renewal rates, net revenue retention, and cohort retention curves.
Further reading
- ‘The One Number You Need to Grow’Fred Reichheld, Harvard Business Review (December 2003). The original article. Worth reading for the actual methodology claim before deciding how much weight to give the score.
- The Ultimate Question 2.0Fred Reichheld and Rob Markey (2011). The full NPS System framework, including closed-loop follow-up and the organizational changes needed to make scores meaningful.
- ‘A Longitudinal Examination of Net Promoter and Firm Revenue Growth’Timothy L. Keiningham, Bruce Cooil, Tor Wallin Andreassen, and Lerzan Aksoy, Journal of MarketingVol. 71 (July 2007), pp. 39 to 51. Winner of the Marketing Science Institute/H. Paul Root Award. The most-cited academic rebuttal to Reichheld’s growth-prediction claim. Read this alongside the original article for an honest picture of what the score can and can’t do.
- ‘The Net Promoter Score (NPS) Fails to Predict Revenue Growth’Sebastian Lundmark, Jon A. Krosnick, et al. Marketing Science Institute Working Paper No. 23-111 (2023). A large-sample analysis using Bayesian regression across 30+ U.S. companies, reinforcing the limits of NPS as a growth predictor.
- The Effortless ExperienceMatthew Dixon, Nick Toman, and Rick DeLisi (2013). The CEB research that introduced Customer Effort Score and challenged the delight-drives-loyalty assumption. Essential context for understanding where NPS falls short at the transactional level.
Sources: Fred Reichheld, ‘The One Number You Need to Grow,’ Harvard Business ReviewDecember 2003 (HBR.org; PubMed PMID 14712543). Bain & Company and Satmetrix Systems, netpromotersystem.com. Retently industry NPS benchmark data (retently.com/blog/good-net-promoter-score), a vendor benchmark with no published sample, cited here only as a directional illustration. Qualtrics XM Institute, ‘2024 XMI Customer Ratings, Consumer NPS,’ Q3&Q4 2024 U.S. Consumer Benchmark Study (10,000 consumers, 354 companies, 22 industries); qualtrics.com. Timothy L. Keiningham, Bruce Cooil, Tor Wallin Andreassen, and Lerzan Aksoy, ‘A Longitudinal Examination of Net Promoter and Firm Revenue Growth,’ Journal of MarketingVol. 71, No. 3 (July 2007), pp. 39 to 51; winner of the Marketing Science Institute/H. Paul Root Award; doi.org/10.1509/jmkg.71.3.039. Sebastian Lundmark, Jon A. Krosnick, et al. ‘The Net Promoter Score (NPS) Fails to Predict Revenue Growth,’ Marketing Science Institute Working Paper No. 23-111 (2023); msi.org/working-paper/the-net-promoter-score-nps-fails-to-predict-revenue-growth. Timothy L. Keiningham et al. share-of-wallet variance finding reported in The Wallet Allocation Rule (Wiley, 2015): CX attitudinal metrics including NPS typically explain less than 1% of variance in share of wallet. Matthew Dixon, Nick Toman, and Rick DeLisi, The Effortless Experience (Portfolio/Penguin, 2013), source of CEB’s 96% high-effort disloyalty finding. Corporate Executive Board (CEB, now Gartner) Customer Effort Score original research, 2010. Geoff Colvin, “Net Promoter Score: The simple metric that’s taking over big business,” Fortune (May 2020), the source of the Fortune 1000 adoption figure. Wikipedia: Net Promoter Score.
Brian Kasday spent forty years in direct-response marketing before rebuilding the whole operation as a one-person shop. He writes The Operator’s Library — including “Build a Complete Marketing Department” — for operators who’d rather build it themselves than wait on someone else.
Build the department these ideas describe — the free companion kit: mmsvegas.com/resources.
More The Operator's Canon guides
Free · Operator Toolkit
Want the tools, not just the guide?
Get the free operator toolkit — templates and checklists for the systems you actually run, plus a note when this guide changes.
Get the free toolkit →How to cite: Net Promoter Score (NPS). Associated with Fred Reichheld / Bain & Company, 2003. The Operator’s Canon, MMS Vegas. https://mmsvegas.com/library/net-promoter-score-explained/