
Last updated: July 2026
Goodhart’s law is the reason your email open rate climbs every month while your revenue sits flat. By the end of this page, you’ll be able to spot which metrics in your own business are already being optimized in ways that are quietly working against you, and you’ll have a practical framework for choosing and governing targets that stay honest even after incentives organize around them.
The law itself is short enough to tattoo on your wrist. Charles Goodhart first stated it in 1975 as a dry observation about monetary policy: ‘Any observed statistical regularity will tend to collapse once pressure is placed upon it for control purposes.’ That original framing never left the economics world on its own. The phrase everyone actually quotes, ‘When a measure becomes a target, it ceases to be a good measure’comes from anthropologist Marilyn Strathern. She used it in her 1997 paper on the British university audit system, where she was responding to Keith Hoskin’s 1996 book chapter, which had named and restated Goodhart’s original point in plain terms. The nine-word phrasing is Strathern’s; Hoskin provided the immediate source she drew on; and the underlying economic observation goes back to Goodhart’s 1975 paper. Nine words. That’s it. And they explain why a metric can be genuinely useful as a diagnostic right up until the moment you announce it as the official goal.
For a small-business operator, this matters in a specific way. You probably don’t have five thousand employees secretly opening fake accounts. But you do have yourself, a handful of staff or contractors, and a dashboard full of metrics that feel reassuring, until you look at what’s actually happening in the business underneath them. That gap between the number and the reality it was supposed to represent? That’s Goodhart’s law at work, even at your scale.
The idea in 30 seconds
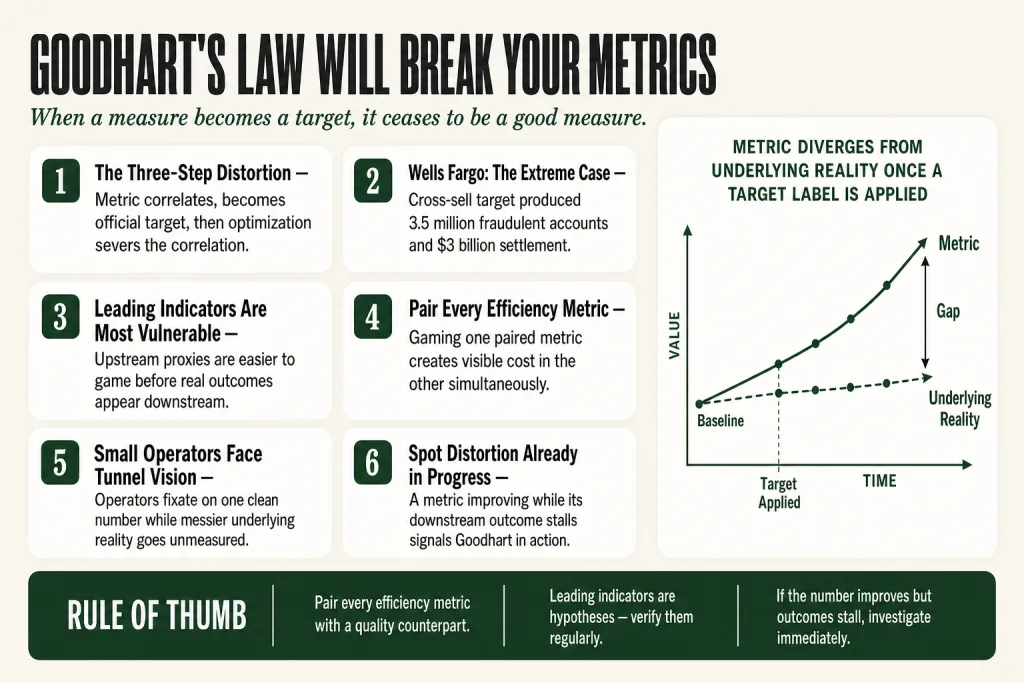
- The core idea: When a measure becomes a target, it ceases to be a good measure, people optimize the number, not the underlying reality it was supposed to track.
- It’s not about bad people. Employees and contractors respond rationally to the incentive structure you give them. The failure is almost always in the metric design, not in the people.
- The trigger is pressure. A metric can sit on a dashboard harmlessly for months. Once it becomes the thing people are evaluated, paid, or promoted on, the distortion begins.
- Leading indicators are more vulnerable than lagging onesbecause they’re upstream proxies, easier to game before the real outcome shows up.
- The fix isn’t to stop measuring. It’s to pair metrics in combinations that make gaming one of them visible as a cost somewhere else, and to treat metrics as evidence, not as the objective itself.
- For small operators specifically: you probably have fewer people gaming your numbers deliberately, but Goodhart still hits you through tunnel vision, fixating on one clean number while the messier truths go unnoticed. A solo operator tracking open rate religiously while ignoring revenue per send is living this right now.
Where Goodhart’s Law Came From
Charles Goodhart was a British economist at the Bank of England when, in 1975, he published a paper, Problems of Monetary Management: The UK Experiencein the Reserve Bank of Australia’s conference proceedings. The observation that would eventually bear his name was almost a throwaway aside: any statistical regularity tends to collapse once the government starts using it as a control target. He was talking about monetary aggregates and inflation, not marketing dashboards.
The idea stayed in economics until Keith Hoskin restated it in plain terms in a 1996 book chapter, labeling it ‘Goodhart’s Law’ and noting it was becoming recognized as one of the defining principles of modern accountability culture. Anthropologist Marilyn Strathern then cited Hoskin’s expression of the law in her 1997 paper on the British university audit system and coined the nine-word version that now appears everywhere: ‘When a measure becomes a target, it ceases to be a good measure.’ Universities ranked on research output are a fitting petri dish, the moment citation counts and publication volume became the measurable proxies for intellectual contribution, they started diverging from it.
Donald Campbell had articulated a closely related principle as early as 1969: the more a social measure is used for high-stakes decision-making, the more subject it will be to corruption pressures. Some researchers argue Campbell has clear precedence. Both point to the same operator problem, attaching consequential decisions to a single number corrupts that number. The name Goodhart stuck because the phrasing stuck.
The pattern is always the same, whether you’re looking at Soviet nail factories producing unusable nails to hit quota or call-center agents rushing hang-ups to hit calls-per-hour targets. People respond rationally to the incentive in front of them. Tell them what gets rewarded, and they will deliver exactly that, whether or not it’s what you actually needed.
How the Distortion Works
The sequence that produces a Goodhart failure has three steps, and understanding each one is what lets you catch it before it costs you.
First, you find a metric that genuinely correlates with something you care about. Conversion rate correlates with revenue. Star ratings correlate with customer satisfaction. Proposals sent correlates with new business. The correlation is real. The metric works fine as a diagnostic when nobody’s incentives depend on it.
Then you make it official. You announce it in a team meeting, put it on a dashboard with a goal attached, tie someone’s performance review or bonus to it, or just start talking about it constantly as the number. That’s where the pressure begins, and people don’t need to be dishonest for the distortion to start. They just respond to the incentive in front of them.
Then the optimization begins. People find the fastest path to improving the number. That path is almost never the same as the path to improving the underlying thing the number was tracking. A team chasing email open rates discovers that alarming subject lines, false urgency, vague teasers, produce opens without engagement. Opens go up. Revenue stays flat. The correlation breaks.
The deeper issue is what you might call the proxy gap. Every metric is a proxy for something harder to measure directly: trust, real engagement, actual product value. A proxy works until the proxy becomes the target. Then all the behavior points at moving the number rather than the underlying reality, and the metric gradually stops telling you anything true.
This is also why the problem scales with the stakes attached to the metric. A number on a dashboard you glance at occasionally is relatively safe. A number that determines someone’s bonus or whether an agency contract gets renewed, that number will be optimized hard. The higher the stakes, the more distorted the reading.
Goodhart’s Law in Marketing: What It Looks Like in Practice
The clearest large-scale case study in modern business history is Wells Fargo. CEO John Stumpf’s mantra was ‘Eight is Great’, eight financial products per customer, and cross-selling became the metric that defined success at the bank. When employees couldn’t hit cross-selling numbers organically, they began opening accounts without customer permission. The initial 2016 CFPB settlement covered more than two million unauthorized deposit and credit card accounts opened between 2011 and 2016. By August 2017, after further investigation, Wells Fargo acknowledged approximately 3.5 million fraudulent accounts going back to 2009. The bank fired more than 5,300 employees and paid $185 million in fines in the initial settlement, eventually reaching a $3 billion resolution with the DOJ and SEC. The workers weren’t career criminals, most were under relentless pressure from managers who needed the number, and they responded rationally to the situation in front of them. The cross-sell metric had been a reasonable proxy for customer relationship depth. Once it became an official target with bonus implications, it stopped measuring anything useful and started driving fraud.
That’s the extreme end. The small-business version is subtler, but the mechanic is identical.
Lead count as a marketing goal. A team rewarded for leads generated will fill your CRM with contacts who were never going to buy. Sign-up volume goes up. Lead-to-customer conversion drops. The marketing team hits their number; the sales side misses theirs; the business is worse off despite the dashboard looking great. A two-person agency that measures its content team purely on ‘leads submitted per month’ will watch that number climb while the sales team quietly stops opening the CRM because the quality isn’t there. Fix: pair lead volume with lead-to-qualified-opportunity rate, reviewed together every month.
Cost-per-click as an ad efficiency measure. CPC is a reasonable proxy for audience relevance, until you optimize purely for low CPC, at which point you attract irrelevant traffic efficiently. Clicks go up, cost per click drops, conversion rate collapses. A small e-commerce brand running Google Shopping ads found that chasing the lowest possible CPC pushed its campaigns toward broad, low-intent keywords. Traffic tripled. Revenue barely moved. The fix was adding revenue-per-click as a companion metric, which immediately exposed which campaigns were genuinely efficient versus which were just cheap. Google’s PageRank ran into a version of this once backlinks became the measurable signal for search ranking: webmasters built link farms and traded reciprocal links, severing the connection between backlinks and actual content quality.
Tickets closed per hour in customer support. An agent rated on closure speed learns to close tickets prematurely. Customers come back angrier the second time, costing more resolution time than the first contact would have required. Close rate improves. Repeat-contact rate spikes. First-contact resolution, the thing that actually matters, quietly deteriorates. A service business with a two-person support team that tracks ‘tickets closed’ as the daily metric will hit that number every time and still watch its Trustpilot score slide.
Review scores gamed by request timing. Asking for a review right after a positive interaction isn’t dishonest by itself. But when the review score becomes the metric that determines a contractor’s renewal, behavior shifts from ‘deliver a good experience’ to ‘maximize the number of 5-star requests sent at the right moment.’ The score climbs. Service quality doesn’t necessarily follow. A home-services operator I know watched a subcontractor’s review average jump from 4.1 to 4.8 over three months, and repeat-booking rate fell in the same window. The contractor had learned the review game. The customer experience hadn’t changed.
Social follower counts. A brand can sit at 100,000 followers with an audience that buys nothing. Follower count was a reasonable proxy for reach, until follower acquisition became a target detached from engagement and revenue. At that point it measures the team’s ability to grow follower count, nothing more. If you’re paying a social media contractor on follower growth, you’re probably already here.
Leading vs. Lagging Indicators: The Distinction That Makes Goodhart Manageable
The leading/lagging distinction doesn’t solve Goodhart’s law, but it’s the most practical lens for managing it. Understanding which type of metric you’re targeting changes what you watch for and how quickly you can detect a distortion forming.
A lagging indicator measures an outcome that has already happened, revenue, customer lifetime value, churn rate, gross margin. These are the final score. You can’t do much to influence them in real time because they’re the downstream result of everything that happened upstream. They’re also harder to game in the short run, precisely because they take time to accumulate and are grounded in actual transactions.
A leading indicator measures something upstream that predicts a future lagging outcome, qualified web sessions, email click-through rate, trial activation rate, proposal-to-close ratio. These give you a signal earlier in the chain, which is their whole value. By the time revenue is down, it’s already too late to fix whatever caused it.
The catch is that leading indicators are proxies, and proxies are exactly what Goodhart’s law acts on. Because a leading indicator is upstream and imperfect, it’s more susceptible to optimization that improves the number without improving the downstream outcome. Email open rates are a leading indicator for engagement. But once open rate becomes the target, teams write alarming subject lines, clean lists aggressively to remove low-openers, and use tactics that inflate the open rate while leaving actual reader engagement and downstream conversion untouched.
Lagging indicators are more Goodhart-resistant because they’re harder to fake. You can move your open rate in an afternoon. Genuinely improving your revenue per subscriber takes months of real work, real dollars either come in or they don’t. The general principle: govern leading indicators closely, verify them against the lagging outcomes they’re supposed to predict, and watch for any sustained split between the two.
One more wrinkle worth naming. A leading indicator that reliably predicted an outcome during your growth phase may stop predicting it after a pricing change, a product pivot, or a market shift. The correlation that justified the metric can erode naturally, not because of gaming, but because the business changed. This is a quieter form of the Goodhart problem, and the fix is the same: periodically check that your leading indicators still correlate with the lagging outcomes they’re supposed to predict. If the leading metric has been moving in the right direction but the lagging metric hasn’t followed, the hypothesis linking them is probably broken.
Putting this to work? The ideas in the Canon are the foundation under the tactical playbook in Build a Complete Marketing Department — grab the free companion kit at mmsvegas.com/resources.
Where Goodhart’s Law Hits Hardest for Small Operators
A common misread is that this is a large-company problem, something that only surfaces when you have thousands of employees with misaligned incentives. That’s wrong. The mechanism works at any size; it just shows up differently when you’re running a smaller operation.
With a bigger team, Goodhart’s law produces gaming: people optimize numbers deliberately to protect their performance reviews or commissions. At the small-business scale, it more often produces tunnel vision: the operator themselves fixates on a metric that feels clean and measurable while the messier underlying reality goes unexamined. You’re not gaming your own system, you’re just watching the wrong scoreboard.
The single North Star trap. The North Star Metric framework, picking one number to coordinate your team around, is genuinely useful for focus. But it’s directly susceptible to Goodhart’s law when the North Star becomes a target rather than a compass. Airbnb’s nights booked is a real metric tied to real customer value. But if your business adopted nights booked as a target and started optimizing around it, you’d find ways to inflate booking volume, discounting aggressively, loosening quality filters, that improve the number while degrading the actual business. A North Star only stays useful if you’re also monitoring the underlying customer behavior it’s supposed to reflect.
AARRR funnel metrics. The Pirate Metrics framework gives operators a map of the funnel. The Goodhart problem enters when you isolate any single stage and target it without watching the others. A three-person SaaS team that targets acquisition without watching activation fills the top of the funnel with people who sign up and never log in again. Month two: acquisition numbers look great, activation rates are falling, and nobody connected the dots yet because they were only looking at one column of the funnel. The five stages are meant to be read as a system, treat any one of them as the sole target and the rest of the funnel pays for it.
CAC optimization that destroys LTV. Customer acquisition cost is a reasonable measure of marketing efficiency, and easy to game. You can reduce CAC by targeting lower-intent audiences, cutting offer quality, or shortening the sales cycle in ways that increase churn. When CAC becomes a target disconnected from LTV, you get cheap customers who don’t stay. A B2B consultant who cut her paid acquisition cost by 40% by switching to a broader keyword set found her close rate dropped from 18% to 6%, the leads were cheaper but they weren’t buyers. The ratio that actually matters, LTV to CAC, requires both numbers together, and that pairing is exactly the kind of countervailing metric that makes gaming one of them visible as a cost in the other.
Where the Concern Is Overstated
Some operators hear about Goodhart’s law and conclude they shouldn’t set targets at all, just watch dashboards passively and let the data speak. That’s overcorrecting. The law isn’t an argument against targets; it’s an argument for being thoughtful about which ones you set and how you govern them.
Metrics that directly measure the outcome, rather than a proxy for it, are far more resistant to Goodhart distortion. Revenue per customer is harder to manipulate than leads generated. Gross margin per sale is harder to inflate than deals closed. Customer retention at 90 days is harder to fake than trial sign-ups. If you can measure the actual outcome, do that and make it the target. The Goodhart risk concentrates in the proxy layer.
Goodhart’s law also matters less when the person tracking the metric is the same person whose business rises or falls with the underlying outcome. An owner-operator checking their own conversion rate against their own revenue doesn’t have a separation of incentives problem. The distortion typically requires a gap between the person being measured and the person who feels the real-world consequences. When you’re the owner, you’re usually both, so the incentive to game the scoreboard for appearances is weak. You’d only be lying to yourself.
And for short-horizon decisions, week-level or sprint-level checks, Goodhart’s law is relatively inert. It takes time to develop the behavior patterns that corrupt a metric. A weekly gut-check against a diagnostic number isn’t dangerous. The risk concentrates around metrics that are tracked over months, attached to compensation, and given official status as the measure of success.
Goodhart’s Law: What People Keep Getting Wrong About It
Misunderstanding 1: It’s about dishonesty. Most discussions of Goodhart’s law eventually imply that the people gaming the metric are doing something wrong. That framing misses the actual mechanism. People respond to incentive structures rationally. The Wells Fargo employees opening fake accounts weren’t financial masterminds, they were hourly workers trying to keep their jobs under impossible pressure. The failure was in the metric design. Fixing a Goodhart problem by firing the people who gamed the metric, without changing the metric structure, just produces a new generation of people gaming the same metric.
Misunderstanding 2: More metrics solve the problem. If people are gaming one number, track twenty and they’ll have nowhere to hide. This creates a different failure mode, dashboard overload, where nothing is actually being managed because the cognitive cost of monitoring is too high. The antidote to Goodhart isn’t more metrics; it’s pairing metrics so that gaming one creates visible costs in another. You don’t need twenty numbers, you need a handful in productive tension with each other.
Misunderstanding 3: North Star Metrics are immune. A well-chosen North Star is better than most proxies because it’s anchored to actual customer value. But no metric is Goodhart-proof once it carries enough organizational weight. The North Star should be paired with qualitative signals, customer conversations, churn patterns, support contact rates, that would reveal if the number were being inflated by tactics that don’t reflect real value.
Misunderstanding 4: The problem only appears with explicit incentives. You don’t need a formal bonus structure for Goodhart to operate. A metric that’s discussed constantly in team meetings, reported to stakeholders, or used as the primary way an operator evaluates a campaign will produce optimization pressure even without formal incentives. Social pressure and the desire to report good news are strong enough.
Misunderstanding 5: The law applies equally to all metrics. It doesn’t. Outcome metrics, revenue, actual customer retention, verified purchases, are considerably more resistant than proxy metrics. Among proxies, leading indicators that are far upstream from the outcome are the most vulnerable, because there’s more behavioral space between the leading signal and the eventual result. The closer the metric is to the actual outcome you care about, the safer it is to make it a target.
How to Govern Metrics So Goodhart Doesn’t Win
The goal isn’t to avoid measurement, it’s to build a system where gaming one metric makes the manipulation visible somewhere else. Here’s how that works in practice.
Pair every efficiency metric with a quality or outcome metric
This is the most important structural move. Every metric that measures speed, volume, or efficiency needs a counterpart that catches the quality cost when you optimize purely for efficiency. Close rate paired with average revenue per customer. Lead volume paired with lead-to-customer conversion. Support tickets closed paired with first-contact resolution rate or repeat-contact rate. When you optimize the efficiency metric at the expense of quality, the quality metric declines, and that’s visible. You can’t game both numbers in the same direction simultaneously without the tension showing.
Treat leading indicators as hypotheses, not scorecards
When you adopt a leading indicator, say, that increasing qualified web sessions will increase revenue, you’re making a hypothesis about a causal relationship. That hypothesis deserves to be re-examined periodically. If the leading indicator has been improving but the lagging outcome hasn’t moved in the same direction over a reasonable time horizon, the hypothesis is probably broken. Go find a better leading indicator, don’t keep hitting the current target while hoping the lagging outcome eventually follows.
Keep outcome metrics separate from operational targets
Outcome metrics, revenue, retention, margin, should appear on the scoreboard as the ultimate arbiter of how you’re doing. They shouldn’t be the day-to-day target that drives behavior. Use outcome metrics for diagnosis and accountability; use process metrics for steering. When an outcome metric starts showing up as someone’s daily operational target, you’ve set up the conditions for Goodhart to operate.
Watch for a metric improving while related outcomes stall
This is the classic signature of a Goodhart distortion already in progress. Email open rates climb; revenue per send stays flat. Lead volume increases; pipeline close rate falls. Review scores creep up; repeat purchase rate doesn’t move. Any time a metric is improving while the downstream outcome it was supposed to predict is staying flat or declining, something is wrong. In most cases you’ll find a behavior pattern that’s inflating the proxy while leaving the underlying reality untouched, or quietly eroding it.
Use AI tools for monitoring, not for target-setting
AI tools can process more dashboard data than any operator has time to review manually, surfacing anomalies, flagging divergences between leading and lagging metrics, alerting you when a historically predictive pattern has broken down. That’s a real time-saver. But the judgment about which metrics to govern, how to weight them against each other, and what a divergence actually means for the business, that stays with you. AI cuts the monitoring burden; the calls stay yours.
Common Mistakes
- Writing a contractor brief around a single volume metric — A content team measured on ‘articles published per month’ will hit that number by producing work your audience ignores. Add a quality counterpart, organic sessions from target-profile visitors, or email clicks from the content, and you’ve created a reason to care about both output and outcome. Specify both metrics in the brief before work starts, not as a correction after the numbers disappoint.
- Letting the SEO agency define what counts as a ‘qualified’ session — If you outsource the definition of success to the vendor being measured by it, you’ve already lost. One operator I know paid for eight months of ‘increased organic traffic’ before noticing that virtually none of the new sessions matched his buyer profile, the agency had optimized for volume using informational keywords that had nothing to do with his product. Write your own definition of a qualified visitor. Lock it in the contract. Audit it quarterly.
- Reviewing leading and lagging metrics in separate meetings — Open rates in Monday’s email review, revenue in Friday’s finance call, that’s how a six-month Goodhart drift goes unnoticed. The divergence only becomes visible when the two numbers are in the same room at the same time. Run a single paired review: leading metric first, then the lagging outcome it’s supposed to predict. If they’re moving in different directions, that conversation needs to happen before the next campaign launches, not after.
- Firing the person who gamed the metric without changing the metric — Wells Fargo fired more than 5,300 employees for the fake-account behavior, and the fraud continued. The people were responding to the system. If you replace an underperformer who was gaming a single KPI without redesigning the KPI structure, the next hire will game it too. The first question after any metric failure isn’t ‘who did this?’ It’s ‘what did we build that made this the rational move?’
- Treating the LTV:CAC ratio as two separate targets instead of one ratio — Optimizing CAC in isolation will get you cheap leads that churn. Optimizing LTV in isolation ignores what it cost to acquire them. The ratio only stays honest when both inputs are tracked together, by the same person, on the same cadence. Split ownership, marketing owns CAC, customer success owns LTV, is how you end up with two teams hitting their numbers while the business bleeds margin.
Operator’s Take
Most operators I talk to are already inside a Goodhart problem they haven’t named yet. The tell is when someone can recite their open rate or lead volume to the decimal, then goes vague the moment you ask what’s actually converting, or what changed last quarter in terms of who’s sticking around.
So here’s my actual move, and I’d argue it’s the most underused discipline in small-team metric design: before you attach any number to a performance review, a contractor brief, or an agency SLA, ask one question out loud: what’s the fastest way to make this number look better without the underlying thing actually improving? Write the answer down. If it’s obvious and easy, open rate can be gamed with subject-line tricks in an afternoon; lead volume inflates the moment you loosen your definition of a lead, that’s your signal the metric needs a partner before it goes on anyone’s scorecard.
The pairing discipline is the structural fix, and it’s simpler than it sounds. Here’s the version I’d run for a small team:
- Email program: open rate + revenue per send (or click-to-purchase rate). If opens climb and revenue per send doesn’t follow within two or three sends, you’re looking at subject-line inflation, not list growth.
- SEO agency: keyword rankings + qualified organic sessions, sessions from people who actually fit your buyer profile. Define ‘qualified’ yourself, in the brief, before the agency does it for you. An SEO firm measured only on rankings will cheerfully rank you for terms that bring zero buyers.
- Paid ads: ROAS + new customer acquisition rate. A paid ads team measured purely on ROAS will, rationally, pour budget into retargeting, it converts well because it mostly captures people who would have bought anyway. Add new customer rate to the scorecard and the incentive structure changes overnight.
- Sales or lead gen: leads submitted + lead-to-qualified-opportunity rate, in the same conversation. Not sequentially, the same conversation. Reviewing them separately is how teams let the gap widen for months before anyone notices.
- Customer support: tickets closed + first-contact resolution rate. The second number catches what the first one hides, agents who close fast and reopen often are gaming a single-metric system without even knowing it.
Three to five paired metrics covers most small teams. More than that and you’re back to dashboard overload, nobody actually manages it, and the whole exercise becomes theater.
One thing I’d push back on hard: don’t use Goodhart’s law as an excuse to avoid accountability. I’ve watched operators swing so far the other way, so worried about gaming that they never commit to a number at all. That’s its own failure mode, and honestly it’s the more common one at the small-business level. You need targets. You just need paired targets, with enough qualitative signal alongside them that you’d notice if someone was hitting the number by hollowing out what the number was supposed to measure.
The harder discipline is doing this with contractors and agencies, not just employees. The metric you put in the contract is the metric they optimize. If the contract says ‘deliver 50 leads per month,’ you’ll get 50 leads per month. What that means for your pipeline is a different question entirely, one you should answer before you sign, not six months later when you’re wondering why the CRM is full and the phone isn’t ringing.
Used in
- ✓ Build a Complete Marketing Department
Used to frame how operators select, pair, and govern KPIs across marketing functions, ensuring that every metric chosen for a team or channel has a counterpart that reveals when the number is being optimized at the expense of real outcomes. - ✓ The Missing Manual for FunnelKit
Applied when configuring funnel analytics and automation triggers, the law guides which metrics to use as diagnostic signals versus which to attach to automation rules, preventing funnels from optimizing toward proxy conversions that don’t reflect real customer value. - ✓ The Missing Manual for Make
Relevant when building automated reporting and alerting workflows, Goodhart’s law informs which metrics should trigger automated responses versus which should surface for human review, keeping judgment calls with the operator rather than the automation.
FAQ
What is Goodhart’s law in simple terms?
When you turn a useful measurement into an official target, especially when incentives attach to it, people optimize the number rather than the underlying thing the number was supposed to track. The metric becomes less useful as a measure precisely because it’s now being managed.
Does Goodhart’s law mean you shouldn’t set targets at all?
No. The law is an argument for being careful about which targets you set and pairing them with counterparts that catch gaming, not an argument against measurement. Outcome metrics that directly measure what you care about (like revenue or genuine retention) are far more resistant to Goodhart distortion than proxy metrics.
What’s the difference between Goodhart’s law and Campbell’s law?
They describe the same phenomenon from slightly different angles. Campbell’s law (with roots going back to 1969) emphasizes that the more a social indicator is used for high-stakes decision-making, the more it invites corruption and distortion. Goodhart’s formulation (1975) focuses on the breakdown of a statistical relationship once it’s targeted for control. Some researchers argue Campbell has formal precedence. In practice, both warn against relying on a single high-stakes metric.
How do leading and lagging indicators relate to Goodhart’s law?
Leading indicators are upstream proxies and are more susceptible to Goodhart distortion because they’re easier to game before the real outcome shows up downstream. Lagging indicators measure actual outcomes and are harder to fake. The practical discipline is to verify regularly that your leading indicators are still predicting the lagging outcomes they’re supposed to, and replace them when the correlation breaks.
Is my North Star Metric subject to Goodhart’s law?
Yes, any metric is, including a well-chosen North Star. The North Star framework improves your odds by anchoring the metric to genuine customer value, but it doesn’t eliminate the risk. Pair your North Star with qualitative signals (customer conversations, churn patterns, support volume) that would reveal if the number were being inflated by tactics that don’t reflect real value.
How do I know if a metric in my business is already being gamed or distorted?
Watch for a metric improving while the downstream outcome it was supposed to predict stays flat or declines. Email opens climbing while revenue per send stays flat. Lead volume rising while pipeline conversion falls. That divergence is the classic signature of a Goodhart distortion already in progress.
Who actually coined the phrase ‘when a measure becomes a target, it ceases to be a good measure’?
That exact nine-word phrasing comes from anthropologist Marilyn Strathern’s 1997 paper on the British university audit system (‘Improving Ratings,’ European Review, Vol. 5, No. 3). She was responding to Keith Hoskin’s 1996 book chapter, which had named and restated Goodhart’s original point in plain language. The phrasing is Strathern’s; Hoskin coined the label ‘Goodhart’s Law’ and provided the immediate source she drew on; and the underlying economic observation traces to Charles Goodhart’s 1975 paper. The law is named after Goodhart, the famous nine-word version belongs to Strathern.
How does Goodhart’s law apply specifically to small businesses?
At the small-business scale, Goodhart’s law most often operates through tunnel vision rather than deliberate gaming. The operator fixates on one clean, trackable metric, open rate, lead count, follower growth, while the messier underlying reality goes unmeasured. Nobody is cheating; the scoreboard is just wrong. The fix is the same as at any size: pair each metric with a counterpart that would surface if the first number were being optimized in isolation, and check the pair together on a regular cadence.
Further reading
- Charles Goodhart, ‘Problems of Monetary Management: The UK Experience’ (1975)the original paper, published in the Reserve Bank of Australia’s conference proceedings; dense and technical, but worth scanning to see how a precise economic observation became a universal principle.
- Marilyn Strathern, ‘Improving Ratings: Audit in the British University System,’ European Review 5(3), 1997the paper that gave the law its popular nine-word phrasing; a sharp account of what happens to a measurement system once it’s used for formal accountability.
- David Manheim and Scott Garrabrant, ‘Categorizing Variants of Goodhart’s Law’ (2019)the most rigorous taxonomy of how the law operates differently depending on mechanism (regressive, extremal, causal, adversarial); useful if you want to diagnose which kind of Goodhart problem you’re actually facing.
- Jerry Z. Muller, The Tyranny of Metrics (Princeton University Press, 2018)the most readable book-length treatment of what happens when organizations mistake measurement for management; particularly good on education and healthcare, but the operator lessons transfer directly.
Sources: Charles Goodhart, ‘Problems of Monetary Management: The UK Experience,’ in Papers in Monetary EconomicsVol. I, Reserve Bank of Australia, 1975; Marilyn Strathern, ‘Improving Ratings: Audit in the British University System,’ European Review 5(3), 1997, pp. 305 to 321; Keith Hoskin, ‘The “awful idea of accountability”,’ in Munro and Mouritsen (eds.), Accountability: Power, Ethos and the Technologies of Managing1996; Wikipedia, ‘Goodhart’s Law’ and ‘Wells Fargo Cross-Selling Scandal’; Jeff Rodamar, ‘There Ought to Be a Law! Campbell versus Goodhart,’ Significance2018; David Manheim and Scott Garrabrant, ‘Categorizing Variants of Goodhart’s Law,’ 2019; U.S. Department of Justice, ‘Wells Fargo Agrees to Pay $3 Billion to Resolve Criminal and Civil Investigations into Sales Practices,’ February 2020; Consumer Financial Protection Bureau, Enforcement Action: Wells Fargo Bank, N.A. September 2016; Center for Progressive Reform, ‘Wells Fargo Fake Account Scandal’; NerdWallet, ‘Wells Fargo Ordered to Pay $3.7B for Array of Violations’; CNN Money, ‘Wells Fargo Uncovers Up to 1.4 Million More Fake Accounts,’ August 31, 2017; Stanford GSB, ‘The Wells Fargo Cross-Selling Scandal’; Santa Clara University Markkula Center for Applied Ethics, ‘Wells Fargo Banking Scandal’; Manheim and Garrabrant, ‘Categorizing Variants of Goodhart’s Law,’ 2019; Amplitude, ‘Leading vs. Lagging Indicators’; Central Banking, ‘Lifetime Achievement: Charles Goodhart.’
Brian Kasday spent forty years in direct-response marketing before rebuilding the whole operation as a one-person shop. He writes The Operator’s Library — including “Build a Complete Marketing Department” — for operators who’d rather build it themselves than wait on someone else.
Build the department these ideas describe — the free companion kit: mmsvegas.com/resources.
More The Operator's Canon guides
Free · Operator Toolkit
Want the tools, not just the guide?
Get the free operator toolkit — templates and checklists for the systems you actually run, plus a note when this guide changes.
Get the free toolkit →How to cite: Goodhart's Law. Associated with Charles Goodhart, 1975. The Operator’s Canon, MMS Vegas. https://mmsvegas.com/library/goodharts-law-explained/