
Last updated: July 2026
Time to value is the distance between the moment a customer hands you money and the moment they experience the outcome they actually came for. By the end of this page, you’ll be able to identify where that moment lives in your own business, spot what’s hiding or delaying it, and make concrete changes that keep customers from disappearing before they ever see your product work.
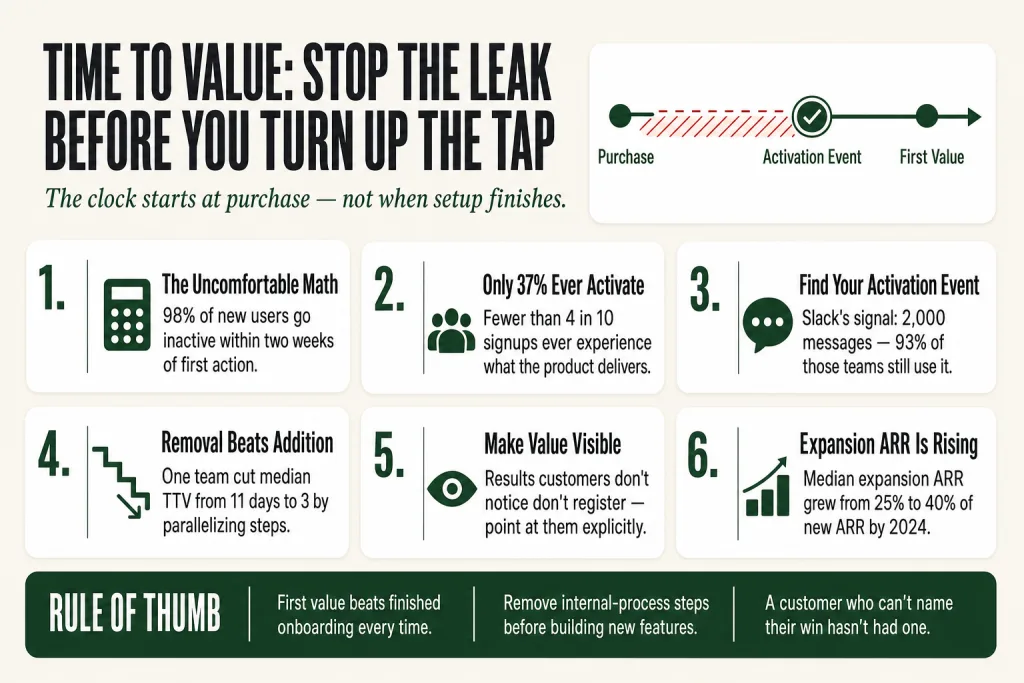
Here’s the uncomfortable math: a customer who hasn’t experienced value yet hasn’t really bought anything, they’ve made a bet. Every day between purchase and that first real outcome is a day they’re questioning whether they backed the right horse. Most of them won’t tell you. They’ll just stop logging in, stop replying, stop renewing. And by the time you notice, the decision was made weeks ago.
This is the problem time to value solves, or rather, the problem a short TTV prevents. It’s not a customer-experience nicety. It’s the mechanism that determines whether your acquisition spend turns into revenue that compounds or into a leaky bucket that drains it.
The idea in 30 seconds
- Time to value (TTV) is the elapsed time between a customer’s purchase and the moment they experience the specific outcome they came to buy, not when they finish a setup checklist.
- Most operators lose the majority of churned customers before those customers ever see the product work. Shortening TTV is retention work, not onboarding polish.
- Your TTV starts with defining the right activation event, a specific, observable action that correlates with long-term retention, not a proxy like ‘completed tour’ or ‘profile filled out.’
- Amplitude’s 2025 Product Benchmark Report, drawn from data across more than 2,600 companies and 10,600+ digital products, found that more than 98% of new users on the median product go inactive within two weeks of their first action. The full report and supporting analysis are available at amplitude.com/blog/time-to-value-drives-user-retention.
- TTV applies far beyond SaaS, any service, subscription, or high-consideration purchase has a version of it, and most small businesses have never mapped theirs.
- The fastest path to a shorter TTV is almost always fixing onboarding friction and surfacing existing value more visibly, not building new product features.
Where the Idea Came From
The phrase ‘time to value’ started in enterprise IT procurement, a way of asking whether a data-center upgrade would pay off in 18 months or 36. The underlying question was sharp: when does the thing actually work, as opposed to when does the project officially close?
It migrated into SaaS during the 2007 to 2012 window. Dave McClure’s AARRR framework sharpened the question: not ‘will this software ever pay off?’ but ‘when does a new user first feel it?’ Lincoln Murphy pushed TTV into the retention vocabulary in the early 2010s, making the argument plainly, a customer who hasn’t experienced value hasn’t fully committed, and churn starts there, not at renewal.
Product-led growth then codified it. Slack, Dropbox, and Figma each built early growth on one engineered answer: what’s the fastest path from signup to the moment this product obviously works? The lesson worth taking isn’t any specific benchmark number. It’s the method, find the earliest observable action that separates people who stay from people who leave, and build your onboarding around getting customers there fast.
Today TTV is a first-order metric in subscription businesses. The label is newer than the problem. If you run any business where customers pay before they see full results, you have a TTV whether you’ve named it or not.
What Time to Value Actually Means (and What It Doesn’t)
Time to value is the length of time it takes a new customer to experience their first tangible benefit, not the day they signed, not the day setup technically finished, but the day the product delivered a result they actually care about. That distinction matters more than it sounds.
Two mistakes hide in the definition and trip operators constantly.
The first is confusing TTV with time-to-onboard. TTV measures the elapsed time between signing up and experiencing the specific outcome the customer came to buy. It is not the same as time-to-onboard, which measures when a customer finishes a checklist. The checklist can be 100 percent complete while the customer still has no idea why the product matters. An onboarding checklist is a proxy for engagement. TTV is the real thing.
The second is confusing TTV with the ‘aha moment.’ The aha moment is a realization, when a customer understands your product could help them. TTV is when they actually get the outcome they came for. The aha moment can precede TTV and happen multiple times. One is a realization; the other is a result.
There are meaningfully different flavors worth distinguishing:
- Time to Basic Value (TTBV): The earliest stage of value, the hook that signals what greater value is possible. A foot in the door, not the full outcome.
- Time to First Value (TTFV): The moment a new user achieves their first tangible outcome tied to why they signed up. For simpler products, this can happen in the first session.
- Time to Exceed Value (TTEV): Where customers discover value beyond the core, past the first win, experiencing the product in ways that exceed their original expectations.
For most small-business operators, TTFV is the one to obsess over first. If you can’t get a customer to their first meaningful win, nothing downstream, upsells, referrals, expansions, renewals, has a foundation.
One more thing worth saying: TTV is not limited to SaaS. It applies to any business purchase or implementation, from deploying software to rolling out physical equipment to onboarding into consulting services. A gym with a 90-day introductory program has a TTV. A marketing agency with a 60-day onboarding ramp has a TTV. The clock starts at purchase; it stops at the first real outcome. What happens between those two points is entirely within the operator’s control.
Why It Matters: The Retention Math Is Brutal
Amplitude’s 2025 Product Benchmark Report, drawn from behavioral data across more than 2,600 companies and 10,600+ digital products, found that more than 98% of new users on the median product go inactive within two weeks of their first action. Amplitude published this finding directly in their blog post ‘Time to Value Drives User Retention’ (December 2025), available at amplitude.com/blog/time-to-value-drives-user-retention. Not 30%. Not 50%. This is the scale of the problem most teams are actually facing, treat it as a strong directional signal specific to digital products, not a universal guarantee for every business model.
Easy to read that and think ‘SaaS problem, not my problem.’ But the mechanism, a customer who hasn’t experienced value is a customer about to leave, applies everywhere. The churn just looks different: a client who goes quiet after their first invoice, a gym member who stops showing up after week three, a subscriber who never opens after the welcome email.
Userpilot’s 2024 User Activation Rate Benchmark Report, based on data from 62 B2B SaaS companies, puts the average activation rate at 37.5% with a median of 37%. The full report is available at userpilot.com/blog/user-activation-rate-benchmark-report-2024. Fewer than four out of ten signups ever experience the thing the product was built to deliver. The other six are acquisition cost with no return. They don’t churn loudly. They simply never come back.
The dropoff is steep and fast. Amplitude’s 2025 data, from that same December 2025 post, shows that even for top performers, products at the 90th percentile, day-one activation starts around 21%, drops to roughly 12% by day seven, and falls to about 9% by day 14. Even among the best products, nearly half of activated users are lost in the first week alone.
Flip to the positive: 69% of products with strong early activation were also strong three-month retention performers, per Amplitude’s analysis at amplitude.com/blog/7-percent-retention-rule. The first-week experience shapes everything that follows.
The opportunity compounds further when you look at where growth now comes from. The Benchmarkit 2025 SaaS Performance Metrics Benchmarks Report found median expansion ARR rising from roughly 25% of total new ARR in 2022 to 40% in 2024, a figure corroborated by Maxio’s published analysis of the same dataset at maxio.com/blog/2025-saas-benchmark-report-trends. Onboarding-to-adoption has become a primary engine of net revenue retention. Every dollar you put into shortening TTV pays dividends in renewals, expansions, and referrals, not just in preventing churn.
Every user who churns before experiencing value represents wasted customer acquisition cost. Most operators try to fix this by pouring more into acquisition. That’s the wrong order. Stop the leak before you turn up the tap.
Finding Your Activation Event: The Work Most Operators Skip
You can’t measure or compress TTV until you’ve defined what ‘value’ actually means for your specific customer. This sounds obvious. It is almost universally skipped.
The work starts with finding your activation event, the specific, observable action that separates customers who stay from customers who leave. Define it as a concrete signal, not a checklist item. ‘Completed onboarding’ is not an activation event. ‘Sent 2,000 messages in a Slack workspace’ is. ‘Created and shared one project plan’ is. ‘Closed one ticket using the AI agent’ is. The point is specificity: a countable behavior with a demonstrated link to retention, not a vibe.
The method for finding yours: segment your 30-day-retained users versus churned users and find the earliest product action that separates them. In software, that’s a product analytics query. In a service business, it’s a conversation, talk to your best long-term clients and ask them to describe the first moment they felt the engagement was paying off. Not when the project launched. The first moment they felt it.
Those answers will surprise you. The activation event is rarely what you think it is. A marketing agency might assume it’s ‘campaign live’, but when they ask, they discover it’s ‘first weekly report that showed a number the client actually understood.’ A gym might assume it’s ‘completes first workout’, but retained members describe ‘first time I noticed something in the mirror’ or ‘first time a friend asked what I was doing.’ The activation event lives in the customer’s head, not the operator’s process flow.
A few useful diagnostic questions:
- What’s the first thing a customer does right before they refer someone to you?
- What does a customer describe in their first positive review?
- If a client cancels after three months without using much of what you deliver, what did they never get to?
- What does a long-term, happy client say when you ask them ‘when did you know this was working’?
Once you have a credible activation event, measure TTV by calculating the gap between a customer’s signup or contract date and the date they first completed that milestone. Use product analytics tools or, in a service context, your CRM and project management logs. The goal isn’t a perfect number on day one. It’s a baseline you can actually move.
Putting this to work? The ideas in the Canon are the foundation under the tactical playbook in Build a Complete Marketing Department — grab the free companion kit at mmsvegas.com/resources.
Time to Value in Practice: What Companies Actually Did
The most instructive case study in TTV engineering is Superhuman. According to Gaurav Vohra’s first-person account published on his Substack (April 2025) and republished on First Round Review at review.firstround.com/superhuman-onboarding-playbookVohra personally onboarded hundreds of customers before hiring the first Onboarding Specialist, and at peak the team scaled to dozens of Onboarding Specialists handling tens of thousands of paying customers per year. He spent five years in that human-led phase before the team translated those learnings into a self-serve product experience. The sequence is the lesson: humans figured out what fast value felt like before software was asked to scale it.
That approach worked because it refused to let a customer leave the session without a concrete win. Every session was structured around delivering a specific, felt outcome, not explaining features, not walking through menus. That’s TTV thinking, not onboarding thinking.
Slack’s activation signal, a team exchanging 2,000 messages, correlating with strong retention is a figure that comes from a direct quote by Stewart Butterfield, Slack’s co-founder, in a piece published on First Round Review. Butterfield’s own words: “after 2,000 messages, 93% of those customers are still using Slack today.” That piece is available at review.firstround.com/from-0-to-1b-slacks-founder-shares-their-epic-launch-strategy. The value isn’t in the product; it’s in the behavioral change the product enabled. Every operator should ask the same question: what behavioral change signals that a customer’s life is genuinely different because of what I provide?
Facebook’s early signal ran the same logic: seven friends connected in ten days, a threshold that divided users who stayed from users who didn’t. Neither Slack’s nor Facebook’s number should be imported wholesale into your business, but the method absolutely should be.
Outside tech, the pattern holds. A law firm that gets a client’s first contract redlined and returned in 48 hours, instead of the industry-standard two weeks, just delivered a dramatically faster TTV. That client will renew. The firm that takes two weeks is forgettable by the time the invoice arrives.
How to Shorten Time to Value: The Operator’s Toolkit
Once you’ve defined and measured your TTV, shortening it comes down to two levers: removing friction from the path to first value, and surfacing that value more visibly when it arrives. Most of the work is removal, not addition.
Remove the friction before first value
The most common friction points:
- Setup requirements that frontload effort. Every form field, configuration step, or account connection required before the product does anything useful delays TTV. Get users into the product as fast as possible and collect additional data progressively. The same logic applies to any service onboarding: intake questionnaires, kickoff calls, and discovery docs all push the clock forward before a customer sees a single result.
- Hiding the valuable part too deep. Most products and services bury their core value behind complexity. The customer who came for report generation has to set up data connections first. The client who came for strategic guidance has to sit through a discovery phase first. Some of that is unavoidable. But most operators have never seriously asked: what’s the minimum viable version of first value that we could deliver while deeper setup happens in parallel?
- Measuring the wrong milestones. Most teams can’t see onboarding failures happening because onboarding gets measured by checklist completion and tour-finished events, tidy numbers that move on a dashboard while the cohort quietly empties. If your onboarding metrics don’t include whether a customer reached the activation event, you’re navigating blind.
Detect and rescue stuck customers
Reducing TTV isn’t just about simplifying flows, it’s about detecting when customers stall and intervening before they abandon. The companies with the fastest effective TTV aren’t necessarily the ones with the simplest onboarding. They’re the ones that catch stuck customers and re-engage them before the decision to leave gets made quietly.
In practice, this means setting a threshold, say, 48 hours after signup without reaching the activation event, and triggering a response. That response doesn’t have to be automated. For a small-business operator, it might be a personal email from the founder. A phone call. A check-in message. The point is that you’re detecting the gap before the customer decides to disappear, not after.
AI can help you notice stalled customers at scale once the process exists, flagging users who haven’t completed a key activation step within a defined window, for instance, but the judgment call of what to say and how to help stays with you.
Make value visible when it arrives
Sometimes TTV is short but the customer doesn’t know it. They got the outcome, but no one pointed it out. This is a particular risk in service businesses, where results accumulate gradually and clients normalize wins without attributing them to your work.
The fix is simple: build a rhythm of surfacing outcomes. A weekly report that says ‘here’s what moved this week and why’ doesn’t just communicate results, it dramatically shortens the perceived TTV for customers who haven’t consciously registered that value has arrived. The Peak-End Rule reinforces this: customers remember peak moments and the most recent moment, not the average of everything. If you never highlight the peak, it doesn’t register.
Personalize the path
Asking one or two questions to personalize the onboarding experience is effective, and it doesn’t require a complex segmentation model. In a service context, it’s the intake question you ask on day one that routes a client toward the fastest path to their specific kind of value, not a generic onboarding sequence built for everyone and optimized for no one.
The goal of personalization in TTV isn’t to impress the customer. It’s to remove the wrong paths faster. A customer who came for outcome A shouldn’t have to sit through the onboarding designed for outcome B before anyone figures out the difference.
Where Time to Value Applies Beyond SaaS
Most of the literature on TTV is written for software companies with product analytics dashboards. That framing hides how broadly the idea applies. Any business where customers pay before they experience full results has a TTV, and most small operators have never explicitly mapped it.
A few illustrations:
- Marketing or creative agency: The customer hired you to grow something, revenue, traffic, conversions. When do they first feel that growth? Not when you deliver the first report. When a number they care about visibly moved. TTV might be six weeks. Or it might be eight months because the first project was a brand refresh, and brand doesn’t move fast numbers. If it’s eight months, you should know that going in, and you should have intermediate value moments engineered into the relationship to bridge the gap.
- Professional services / consulting: Clients pay for outcomes they can’t achieve alone. TTV is the distance between the signed engagement and the first moment a client says ‘I couldn’t have done this without you.’ Slow discovery processes, long kickoff phases, and excessive requirements-gathering all delay TTV, often unnecessarily.
- Fitness or wellness: A new gym member’s TTV might be the first time they feel physically different, or the first compliment from a friend. That might be week four or week eight. A gym that structures the first 30 days around visible, fast wins, strength milestones, body-composition snapshots, community connection, is engineering TTV compression even if it never uses that phrase.
- Subscription physical products: A meal kit service’s TTV is the first dinner that genuinely impresses someone. If that doesn’t happen in the first two boxes, the subscription cancels. The best operators in this category use the first box to deliver the highest-probability impressive meal, not the one with the most interesting ingredients.
In every case, the same question applies: what does the customer define as the first moment this was worth it, and how quickly can you get them there?
Where Time to Value Doesn’t Work, or Gets Distorted
TTV is powerful but it gets applied badly in a few predictable ways.
Optimizing for speed at the expense of depth. Shortening TTV to the point where the ‘first value’ is trivial creates the illusion of retention without the substance. A tool that lets a user publish their first post in 30 seconds has a great TTFV, but if that post requires real craft to do well, the 30-second version might be a false win. The customer experiences something, but it’s not really the thing they came for. Fake fast is worse than slow real, because it generates churn with a confused cause.
Applying it to the wrong clock start. ‘Completion,’ ‘benefit,’ and ‘value’ are not always easy to define, and operators who start the TTV clock at contract signature get a different number than those who start it at first active session. Neither is wrong, but mixing them produces useless benchmarks. Define your clock start explicitly and hold it constant.
Treating it as a one-time event. In more complex products, or products that evolve, there may be multiple meaningful value moments during the customer relationship, each with its own TTV dynamic. If you only optimize for first-value delivery and ignore subsequent value moments, you’ll see good day-30 retention but watch customers fall off at month six. TTV is a chain, not a single link.
Confusing TTV with a feature request. When customers churn during onboarding, the instinct is often to build more features. But most TTV failures are delivery failures, not product failures. The capability exists, the customer just never reached it. Before you build anything, check whether the bottleneck is access to existing value, not absence of it.
Neglecting enterprise complexity. Mid-market B2B SaaS typically runs a few weeks depending on data setup and stakeholder count. Enterprise rollouts with data migration, integrations, and security reviews can run weeks to months, and that can still be healthy if it’s steadily improving. The useful benchmark is your own trend, not a competitor’s headline. Aggressive TTV compression at the enterprise level can damage relationships if it rushes past necessary steps. Know which friction is waste and which is legitimate complexity.
Common Mistakes
- Using a vanity milestone as your activation event — A SaaS team tracking ‘completed product tour’ as their activation metric spent months optimizing tour completion rates, only to find churn hadn’t moved. When they compared 90-day retained users to churned users, the separating action turned out to be ‘exported a report to a client.’ Tour completion had zero correlation with retention. The fix: run a cohort split before you commit to any activation metric. If users who hit the milestone don’t retain meaningfully better than those who don’t, the milestone is a compliance metric, find the one that actually divides stayers from leavers.
- Running every onboarding step in sequence when steps could overlap — A B2B software operator required new clients to complete a full data-import process before accessing the core dashboard, which meant customers waited up to ten days before seeing the product do anything useful. When the team mapped the actual dependencies, they realized basic dashboard views could be populated with sample data immediately while the real import ran in the background. Moving two steps to parallel reduced their median TTV from 11 days to 3. The test: draw every step between purchase and first value, then ask which ones genuinely require the previous step to complete, versus which ones are just queued by habit.
- Assuming TTV is owned by the product or onboarding team alone — A SaaS company’s sales team routinely promised ‘you’ll be up and running in a week.’ Onboarding actually took four to six weeks. Customers weren’t failing, they were leaving because the gap between expectation and reality had already eroded trust before onboarding ended. No amount of onboarding optimization closed that gap because the problem was set before the customer signed. Audit your sales call recordings and compare what’s promised to what’s actually delivered in week one. The fix often isn’t faster onboarding, it’s honest positioning.
- Declaring victory after first value and ignoring what comes next — A project management tool saw strong 30-day retention, nearly 70% of activated users stuck around. By month four, that had dropped to 28%. When the team interviewed churned users, the pattern was consistent: ‘I got what I needed for my first project, then I couldn’t figure out what else it was for.’ Their TTV for the second value moment was effectively infinite. Map at least two subsequent value milestones beyond the first, assign time thresholds to each, and build detection for customers who stall between them, not just before the first win.
- Delivering a fast win that isn’t actually the win the customer came for — An email automation platform routed every new user through a ‘send your first email in 5 minutes’ quick-start flow. First-session completion was high. Thirty-day churn was also high. When they surveyed churned users, most said the same thing: ‘I set up a welcome email but I never figured out the segmentation.’ The quick win wasn’t the value the customer came for, it was a demo dressed as an outcome. The test: would a customer, unprompted, describe this moment to a colleague as the reason they bought? If not, you’ve shortened the clock without improving the result.
Operator’s Take
Most operators who hear about TTV nod along and then do nothing, because it sounds like a metrics project. It isn’t. Here’s what to actually do.
Start with three conversations, not a dashboard. Call your three best long-term customers, the ones who’ve renewed without much drama, who refer people, who light up when you ask how things are going. Ask each of them one question: ‘When did you first know this was working?’ Don’t offer categories. Don’t steer them toward product features. Write down exactly what they say. Those three answers will almost certainly describe something more specific, more human, and more surprising than anything you’d have guessed from your analytics. One operator I know heard ‘the first time I didn’t have to explain our numbers to my board’, not a product event at all, but a business outcome the software enabled. That answer changed how they ran every subsequent onboarding session.
Then price the delay you currently have. Pull the last 20 customers who churned in their first 90 days. For each one, try to answer: did they actually reach the activation moment you just defined? In most businesses, the honest answer is: almost none of them did. Count how many days the average churned customer had from signup to when they left. That gap, multiplied across the churned cohort, multiplied by the average contract value, is the cost of your current TTV in real dollars. Write the number down. It tends to make the conversation less theoretical.
Pick one step to cut, not a system to redesign. Map every step between purchase and the activation moment. Then go through each step and ask: does this exist because the customer needs it to receive value, or because your internal process requires it? A mandatory discovery call before any delivery starts. A required profile completion before the core feature unlocks. A two-week requirements phase that could run in parallel with early deliverables. Find one, just one, and remove it or parallelize it. Measure the next 30-day cohort. Repeat.
Set a single tripwire for stuck customers. Define a time window, 48 hours, three days, a week, whatever fits your business, after which a new customer who hasn’t reached the activation event gets a personal outreach. Not an automated sequence. A direct message from a human: ‘You signed up X days ago and I noticed you haven’t [done the specific thing yet]. What got in the way?’ That question, asked consistently, saves more accounts than any nurture flow. Asked across a cohort, it also tells you faster than any funnel report exactly where the friction is hiding. AI can help you identify who needs that message at scale, surfacing customers who’ve stalled past your threshold, but the message itself, and the judgment about how to respond, stays with you.
Fix the sales-to-onboarding gap before you touch anything else. If your sales process sets expectations your onboarding can’t fulfill in the first two weeks, you’ve already extended TTV before the customer signed. A customer whose expectations were properly set arrives at first value faster because they recognize it when it arrives, they’re not waiting for a different outcome than the one you’re delivering. Message match between what you promise in sales and what you deliver in onboarding isn’t just a conversion issue. It’s a retention issue wearing a conversion disguise. Audit your sales call recordings against your actual week-one delivery. That audit alone tends to surface one or two specific mismatches that are quietly killing activation rates.
Build a rhythm of surfacing wins. After you’ve compressed the path to first value, make sure the customer knows they’ve arrived. Results that aren’t pointed out don’t register. A brief weekly update, what moved, by how much, and why, doesn’t just communicate outcomes, it closes the loop on perceived TTV for customers who got the result but haven’t consciously connected it to your work yet. This is especially true in service businesses, where value accumulates gradually and clients normalize progress without attributing it to the engagement. You did the work. Point at it.
Used in
- ✓ Build a Complete Marketing Department
Used to define the activation milestone that governs onboarding design and retention campaigns, the point where marketing’s job transitions into customer success’s job. - ✓ The Missing Manual for FunnelKit
Applied to structure post-purchase automation sequences around delivering first value quickly, triggering the right onboarding step at the right moment rather than a generic welcome series. - ✓ The Missing Manual for Make
Used to build TTV detection workflows, automations that flag customers who haven’t reached the activation event within a defined window and trigger a human or automated intervention.
FAQ
How do I calculate time to value for my business?
Define your activation event, the specific action that separates retained customers from churned ones. Then measure the gap between each customer’s purchase date and the date they first completed that action. The median of that gap across recent customers is your current TTV baseline.
What’s a ‘good’ time to value benchmark?
It depends heavily on product complexity. For self-serve SaaS with a single-player use case, top-quartile TTFV is under five minutes. For products requiring teammate invites or configuration, under 24 hours is strong. For services and complex B2B, weeks may be acceptable, but your own trend over time matters more than any external benchmark. Amplitude’s analysis at amplitude.com/blog/7-percent-retention-rule shows that getting at least 7% of a cohort to return on day seven puts a product in the top quartile for activation performance.
Does time to value apply to physical product businesses?
Yes. Any business where the customer pays before experiencing the full result has a TTV. A meal kit service’s TTV is the first dinner that genuinely impresses. A supplement company’s TTV is the first felt result. The clock and the mechanism are the same; only the measurement method changes.
What’s the difference between an aha moment and time to value?
The aha moment is a realization, when a customer understands that your product could help them. TTV is when they actually get the outcome they came for. The aha moment can precede TTV; they’re not the same event, though they’re closely related.
What’s the single fastest way to shorten TTV?
Audit every step between purchase and first-value delivery and ask, for each one: is this necessary for the customer to receive value, or for your internal process? Remove every step in the second category. Most operators find they can cut onboarding time significantly without any product changes.
How does TTV relate to churn reduction?
Directly. Amplitude’s 2025 Product Benchmark Report, available at amplitude.com/blog/time-to-value-drives-user-retention and drawn from data across 2,600+ companies, found that more than 98% of new users on the median digital product go inactive within two weeks of signing up. Compressing TTV is one of the few retention levers that can move churn materially without touching the product itself.
Further reading
- ‘Hacking Growth’ by Sean Ellis & Morgan BrownDocuments how growth teams at Dropbox and Facebook identified their activation events and engineered onboarding around them; solid grounding for the aha-moment methodology.
- Amplitude, ‘Time to Value Drives User Retention’ (December 2025), The primary source for the 98% two-week inactivity figure and the day-1/day-7/day-14 activation curves. Read it directly rather than through secondary summaries. Available at amplitude.com/blog/time-to-value-drives-user-retention.
- Amplitude, ‘7% Retention Rule Explained’ (May 2026), Source for the top-quartile day-7 threshold and the activation-to-retention correlation data. Available at amplitude.com/blog/7-percent-retention-rule.
- Amplitude 2025 Product Benchmark ReportThe dataset underlying most of the activation and retention benchmarks cited on this page. Covers 2,600+ companies and 10,600+ digital products across industries. Available at info.amplitude.com (PDF).
- Userpilot 2024 User Activation Rate Benchmark ReportSource for the 37.5% average activation rate across 62 B2B SaaS companies. Useful for calibrating what ‘normal’ looks like before you set your own targets. Available at userpilot.com/blog/user-activation-rate-benchmark-report-2024.
- Gaurav Vohra, ‘Obsessing Over Onboarding for 10+ Years,’ Substack (April 2025), republished on First Round ReviewVohra’s first-person account of building and scaling Superhuman’s human-led onboarding, then transitioning to product-led. More useful than most books on the topic. Available at substack.gauravvohra.com and review.firstround.com/superhuman-onboarding-playbook.
- Stewart Butterfield / First Round Review, ‘From 0 to $1B, Slack’s Founder Shares Their Epic Launch Strategy’Primary source for the 2,000-message / 93%-retention figure, in Butterfield’s own words. Available at review.firstround.com/from-0-to-1b-slacks-founder-shares-their-epic-launch-strategy.
- Benchmarkit / Maxio 2025 SaaS Performance Metrics Benchmarks ReportSource for the expansion ARR shift from ~25% to 40% of total new ARR between 2022 and 2024. Available at benchmarkit.ai/2025benchmarks; Maxio’s analysis at maxio.com/blog/2025-saas-benchmark-report-trends.
- DigitalApplied.com, ‘Time to Value: The 2026 SaaS Onboarding Metrics Framework’ (May 2026), A secondary synthesis packaging Amplitude and Userpilot benchmark data alongside a practical activation-event testing framework. Good for operators who want a single-document reference. Available at digitalapplied.com.
Sources:
Amplitude, ‘Time to Value Drives User Retention’ (December 2025), primary source for the 98% two-week inactivity figure and the day-1/day-7/day-14 activation drop-off data, drawn from Amplitude’s 2025 Product Benchmark Report (2,600+ companies, 10,600+ digital products). amplitude.com/blog/time-to-value-drives-user-retention. Amplitude, ‘7% Retention Rule Explained’ (May 2026), source for the top-quartile day-7 threshold (7% of cohort returning on day 7 = top 25% for activation performance) and the 69% early-activation-to-three-month-retention correlation. amplitude.com/blog/7-percent-retention-rule. Userpilot 2024 User Activation Rate Benchmark Reportsource for 37.5% average activation rate and 37% median, 62 B2B SaaS companies. userpilot.com/blog/user-activation-rate-benchmark-report-2024. Gaurav Vohra Substack / First Round Review, ‘Obsessing Over Onboarding for 10+ Years’ (April 2025), primary first-person account of Superhuman’s human-led onboarding, including personal onboarding of hundreds of customers and scaling to dozens of Onboarding Specialists handling tens of thousands of paying customers per year. substack.gauravvohra.com; review.firstround.com/superhuman-onboarding-playbook. Stewart Butterfield / First Round Review, ‘From 0 to $1B, Slack’s Founder Shares Their Epic Launch Strategy’primary source for the 2,000-message activation threshold and 93% retention figure, in Butterfield’s direct words. review.firstround.com/from-0-to-1b-slacks-founder-shares-their-epic-launch-strategy. Benchmarkit 2025 SaaS Performance Metrics Benchmarks Report (via Maxio analysis)source for the median expansion ARR rising from ~25% of total new ARR in 2022 to 40% in 2024. benchmarkit.ai/2025benchmarks; maxio.com/blog/2025-saas-benchmark-report-trends. DigitalApplied.com, ‘Time to Value: The 2026 SaaS Onboarding Metrics Framework’ (May 2026), secondary synthesis citing Amplitude and Userpilot benchmarks. digitalapplied.com.
Brian Kasday spent forty years in direct-response marketing before rebuilding the whole operation as a one-person shop. He writes The Operator’s Library — including “Build a Complete Marketing Department” — for operators who’d rather build it themselves than wait on someone else.
Build the department these ideas describe — the free companion kit: mmsvegas.com/resources.
More The Operator's Canon guides
Free · Operator Toolkit
Want the tools, not just the guide?
Get the free operator toolkit — templates and checklists for the systems you actually run, plus a note when this guide changes.
Get the free toolkit →How to cite: Time to Value (TTV). Associated with Dave McClure & Lincoln Murphy, 2010. The Operator’s Canon, MMS Vegas. https://mmsvegas.com/library/time-to-value-explained/