
Last updated: July 2026
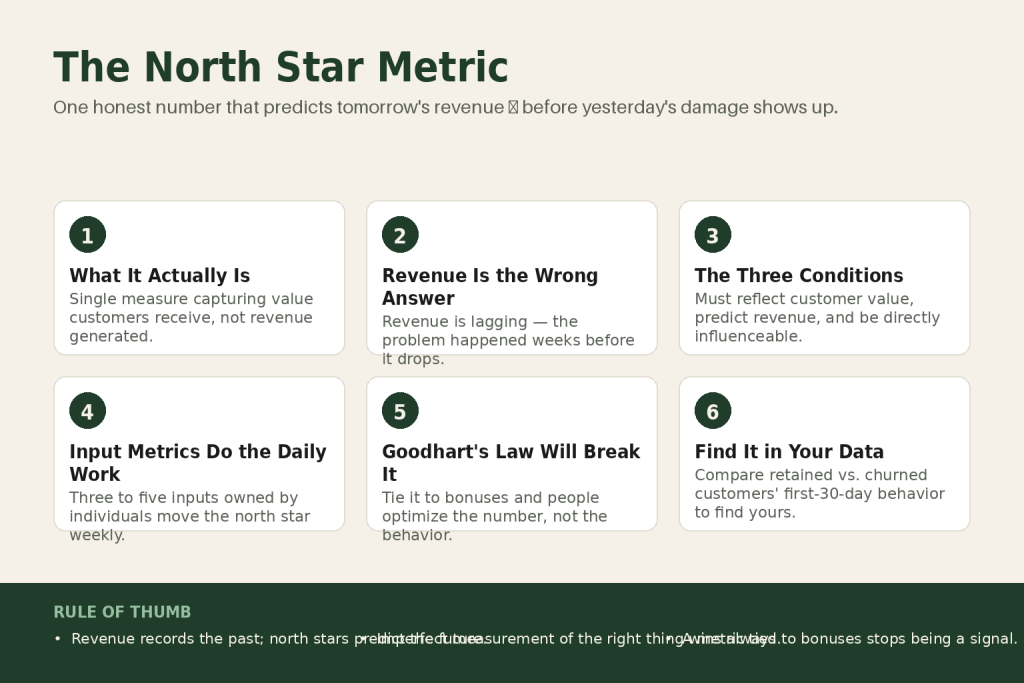
The north star metric is the single measurement that best captures the value your business delivers to customers, and by the end of this page, you’ll be able to identify one for your own operation, explain why most operators accidentally pick the wrong one, and put it to work without building a data team or buying analytics software.
Here’s the problem it solves. Most small businesses don’t lack data. They lack a clear answer to the question: is what we’re doing actually working? So they track everything, revenue, traffic, social followers, open rates, ad spend, conversion rate, and the numbers sit in tabs nobody checks until something goes wrong. Or worse, someone checks the wrong number and feels good about a business that’s quietly declining.
The north star metric is the antidote to that. Not because one number tells you everything, but because one number tells you the most important thing. When it’s moving in the right direction, nearly everything else tends to follow. When it stalls, you know, before the revenue line drops, that something needs fixing.
The idea in 30 seconds
- A north star metric is the single measure most predictive of long-term growth, it captures the value customers actually receive, not just the revenue they generate.
- It must be a leading indicator: something that predicts tomorrow’s revenue, not just records yesterday’s.
- Revenue and sign-ups are almost always the wrong answer, they’re lagging outputs, not causes.
- Every other metric in your business should support the north star, not compete with it.
- Small operators don’t need enterprise dashboards to use this, one honest number, reviewed weekly, changes how every decision gets made.
- Picking the wrong north star is worse than having none; an optimized vanity metric will mislead the whole team.
Where the Idea Came From
Sean Ellis coined the phrase during early-stage growth work at Dropbox, LogMeIn, and Eventbrite, companies where fast growth was creating an alignment problem. Product optimized for engagement. Marketing optimized for sign-ups. Sales optimized for closed deals. Nobody was coordinating around whether customers were actually getting what they paid for.
His answer: one metric that forced the whole company to focus on customer value rather than activity. Ellis defined it plainly, “the single metric that best captures the core value that your product delivers to customers.” The Polaris analogy is intentional: a fixed reference point that holds your course when everything else is moving.
The concept stayed mostly inside growth circles until Amplitude published their North Star Playbookco-authored with product evangelist John Cutler. That document turned a startup heuristic into a documented framework with workshop templates and input-mapping exercises, the version most people encounter today.
The instinct behind it, though, is older. W. Edwards Deming argued for decades that managers who optimize lagging output metrics destroy the systems that produce those outputs. Claude Hopkins, writing in the 1920s, built his entire advertising philosophy around measuring the thing that caused sales, not sales themselves. The north star metric gives that instinct a name and a modern shape. So when someone frames this as a Silicon Valley invention, they’re only half right. The idea that leading indicators beat lagging ones is as old as good management thinking.
What a North Star Metric Actually Is, and Isn’t
A north star metric has to satisfy three conditions simultaneously. It has to reflect customer value, the number rises when customers are genuinely getting what they came for, and falls when they’re not. It has to be a leading indicator of revenue, predictive of what the business will earn tomorrow, not a record of what it earned yesterday. And it has to be measurable and influenceable, your team has to be able to move it through their daily work, not just watch it happen.
That third condition is more demanding than it sounds. “Average revenue per user” fails it. Revenue is real, but the product team can’t directly control it, they control features, flows, and experiences that eventually influence it. A north star metric should sit close enough to the action that people can see a direct line between what they did and what the number did. John Cutler, co-author of the Amplitude North Star Playbook, put it plainly: if you can move your north star directly, it’s probably not a good north star.
Here’s how it plays out across different business models:
- Netflix: widely reported to use hours watched as a primary engagement signal. Every decision about content, UI, and recommendation algorithms connects back to engagement depth. When engagement holds, subscription renewal follows.
- Airbnb: nights booked. One number that captures whether guests are finding stays and whether hosts are earning, both sides of the marketplace in a single metric.
- Dropbox: variously described as files stored and shared, the behavior that signals a user has become dependent on the product. That dependency predicts retention far better than any sign-up count.
- Spotify: time spent listening. Not subscribers, listening. A subscriber who never opens the app cancels. A listener who opens daily doesn’t.
Notice what none of those are. None of them are revenue. None of them are user counts. None of them are social followers or website visits or email open rates. Those things might matter tactically, but they don’t answer the one question a north star metric has to answer: are customers getting the thing we promised them?
There’s also a structural distinction worth flagging. The north star metric is not the same as the One Metric That Matters (OMTM), a sprint-level focus used by individual teams over short cycles. The north star is durable, it stays consistent for years because it reflects what the business fundamentally does for customers. OKRs, quarterly goals, and campaign metrics all sit underneath it.
The North Star Metric and the Leading vs. Lagging Problem
This is where most operators make the mistake that hurts them most. They set revenue, or monthly recurring revenue, or total customers as their north star. It feels logical, those are the numbers the business depends on. But revenue is a lagging indicator. It tells you what happened last quarter. By the time it drops, you’ve already lost the customers causing the drop. The cause of the problem is weeks or months in the past, and you missed it because you were watching the wrong number.
A good north star metric is a leading indicator. It shows whether you’re delivering customer value before that value converts to revenue. When it starts declining, you have a window to fix things, improve the product, change the onboarding, adjust the offer, before the revenue line reflects the damage.
Think of it like a restaurant. An operator who tracks “five-star reviews received this week” has a lagging indicator. The meal is done, the experience is over. But an operator who tracks “tables where the server checked back before the entrée was finished” has a leading indicator, a behavior within the operator’s direct control that predicts whether the five-star review happens at all.
Output metrics can also hide serious problems. Revenue can grow while retention quietly collapses, if you’re acquiring customers faster than you’re losing them, the top line still looks healthy. But a north star metric built around whether customers are actually getting value won’t be fooled. It’ll show the problem before the revenue chart does.
This is where Hopkins’ Scientific Advertising logic is worth holding in mind. He insisted on measuring the thing that caused sales, the ad that pulled orders, the offer that converted. Leading-indicator thinking in the 1920s. The north star metric extends that from ad measurement to the entire business.
How to Find Your North Star Metric
The framework question is: what behavior or outcome, when it happens, proves that a customer received the core value your business exists to deliver?
Not what the customer paid for. What they got. There’s a gap between those two things that most businesses ignore, and the north star lives in that gap.
Work through these questions:
- What is the specific moment when a new customer “gets it”? The moment they realize why they chose you, not when they signed up, but when the promised value clicked. For a bookkeeping service, it might be “first time the client reviewed a clean monthly P&L.” For a gym, it might be “attended four or more sessions in the first month.” For a local delivery service, it might be “orders delivered on time.” The moment of realized value is usually your north star.
- Does the number rise when your best customers engage and fall when disengaged customers churn? Test it against your real customer base. Your happiest, longest-tenured customers should score high on this metric. Customers who churned should have scored low, often before they left.
- Can your team directly influence it through their work this week? If not, it’s too abstract. “Average lifetime value” is real and important, but your front-line people can’t move it on a Tuesday. Find the input that feeds it.
- Is it specific enough to be hard to game? “Customer satisfaction” fails this. Anybody can inflate a satisfaction score. “Customers who completed their first project inside the software within seven days” is harder to fake and more predictive of retention.
For a service business, accountant, consultant, agency, contractor, the north star often looks like a behavior that proves the client is getting ongoing value, not just a deliverable. Examples: clients who reviewed a report and requested a follow-up meeting; clients who referred someone within ninety days; projects that closed with a documented outcome the client acknowledged. None of these are revenue, but all of them predict it.
For a product or e-commerce business, the north star is usually the action that separates browsers from buyers who come back: items reviewed before purchase, orders placed per customer per quarter, products that actually got used rather than returned. Repeat purchase rate is borderline, it’s closer to lagging, but the behavior that drives it is usually where the north star lives.
One more practical test. Ask: if this number doubles, would you confidently expect revenue to grow within six to twelve months? If yes, you likely have a north star. If you’re not sure, or if you can imagine the number doubling while revenue stays flat, it’s probably a vanity metric in disguise.
Putting this to work? The ideas in the Canon are the foundation under the tactical playbook in Build a Complete Marketing Department — grab the free companion kit at mmsvegas.com/resources.
Input Metrics: The Supporting Cast Your North Star Needs
A north star metric does not stand alone. It sits at the top of a small tree of input metrics, the handful of behaviors and activities that, together, cause the north star to move. The inputs are what your team works on day-to-day. The north star is how you know whether the inputs are working.
The Amplitude North Star Playbook names these inputs directly: they’re the levers. If the north star is “completed projects per active client per month” for a software company, the inputs might be: percentage of new users who complete onboarding within 48 hours; number of templates used per session; support tickets closed within one business day. Each input is owned by someone, measurable on a short cycle, and causally connected to the north star.
For a small operator, three to five inputs is plenty. You don’t need a dashboard. You need a weekly ritual, a number everyone on the team knows, a handful of inputs each person owns, and an honest conversation about whether the inputs are moving and whether the north star is following. That’s the whole system.
The inputs also solve a problem that pure north star focus creates: teams can work on the inputs even when the north star moves slowly. The north star might only shift meaningfully quarter to quarter. The inputs can shift week to week. That short feedback loop keeps the work grounded without requiring the team to wait months to know if anything they did mattered.
The North Star Metric in Practice
The big tech examples, Netflix’s engagement depth, Airbnb’s nights booked, Uber’s rides completed, get cited constantly, mostly because they’re clean and easy to understand. But they’re not always the most instructive for operators running businesses below the unicorn threshold. Here are examples that translate better.
B2B SaaS with a self-serve trial. Total trial sign-ups is a vanity metric, it spikes whenever you run ads and collapses when you stop. A stronger north star: trial accounts with more than three users active in the first week. Multi-user early activation predicts conversion to paid far more reliably, because it shows the team actually tried the product together rather than one curious person poking around alone.
HubSpot used the number of weekly active teams as its north star, not weekly active users. The distinction matters because HubSpot is sold to organizations: a team using it actively is far more likely to expand and renew than a single power user navigating it solo. Kieran Flanagan, then VP of Marketing and Growth, disclosed this on the Intercom podcast. HubSpot has since evolved that metric as the business scaled, which is itself part of the lesson.
Shopify oriented around active merchants, not installs, not accounts created, but merchants actively transacting on the platform. The logic is direct: Shopify’s value proposition is helping entrepreneurs sell. A merchant selling is proof the product is working. One who signed up and never listed a product is not.
Membership and course platforms often land on lessons completed per enrolled student. Sign-ups tell you nothing about whether students are learning. Completions tell you everything. An operator running a professional certification program found that students who completed three or more lessons in their first week were five times more likely to finish the full course and renew, and that number was invisible until they started tracking it.
Local service businessescleaning companies, landscapers, HVAC contractors, can use repeat bookings within 90 days. First-time customers are expensive to acquire. A repeat booking within 90 days is a clean signal of satisfaction and stickiness. It leads referrals, renewal, and LTV. Revenue tells you what happened. Repeat booking rate tells you what’s going to happen.
Healthcare technology presents a sharper version of the same pattern: for a digital health intervention, the north star isn’t app logins, it’s a clinical outcome, like re-admission rates for patients who used the product post-event. The question the metric has to answer is always the same: did the customer get what we promised? In healthcare, that question has a very specific, measurable answer.
In every case the pattern holds. The north star catches the moment a customer crosses from “tried it” to “gets real value from it.” That crossing point is where retention lives, where referrals start, and where LTV compounds.
Where the North Star Metric Works Particularly Well
The framework was born in product-led SaaS, and it shows. When you have a digital product generating usage data, finding and tracking a north star metric is relatively straightforward, the behavior that matters usually shows up in the logs.
But the logic applies anywhere you can identify a measurable customer behavior that indicates value delivery. Service businesses, retail, professional services, food and beverage, the north star concept works across all of them. It just requires more thought about what “value delivered” actually looks like in your context, because you’re not watching clickstreams.
The north star is especially useful for operators who are scaling, adding staff, channels, or locations. The moment you have more than one or two people, alignment becomes expensive. Everyone optimizes for something; the question is whether they’re all optimizing for the same underlying outcome. A single north star metric, known to everyone, answers that question without a weekly all-hands or a twenty-page strategy document.
It’s also valuable for operators making budget decisions across channels. If you’re trying to decide whether to invest in SEO, paid ads, referrals, or outbound, the right question isn’t “which channel has the lowest CPA” but “which channel delivers customers who convert to north star behavior fastest and most reliably.” A customer acquired through a referral who completes four service sessions in month one is more valuable than a customer from a paid ad who logs in once and disappears, even if the paid customer cost less to acquire. The north star makes that visible.
Where the North Star Metric Falls Short
The concept has real limits, and anyone selling you a perfect one-number system is oversimplifying.
First, for very early-stage operators, fewer than ten paying customers, still figuring out whether the core offer works, you don’t have enough signal for a north star metric to mean anything. You’re in discovery mode. The north star is a coordination tool for a business that’s found its value proposition; it’s not a substitute for the hard work of figuring out what customers actually want. Get product-market fit first, then install a north star.
Second, some business models are genuinely multi-dimensional in ways that resist a single metric. A two-sided marketplace that needs both supply and demand to grow might find that one metric optimized in isolation creates imbalances. Airbnb’s nights booked works because it inherently requires both guests and hosts to transact. Not every business has that built-in balance, and in those cases, two north stars, tracked as a pair, may be more honest than forcing everything into one number.
Third, the north star metric can be gamed, especially if it’s tied to performance reviews or bonuses. Once a metric becomes a target, it stops being a pure signal. Teams start optimizing for the number rather than the underlying value it’s supposed to represent. This is Goodhart’s Law. The fix is to treat the north star as a diagnostic, not a performance target. Review it, learn from it, act on it, but don’t build compensation around it, at least not directly.
Finally, for businesses with very long sales cycles, think large commercial real estate or major capital equipment, the lag between “customer got value” and “north star metric moves” may be so long that the metric isn’t useful for weekly or monthly decision-making. In those cases, the input metrics do most of the work, and the north star is more of an annual check-in than a weekly compass.
Common Misunderstandings About the North Star Metric
These are conceptual mix-ups about what the north star actually is, before you even start using it.
“My north star is revenue.” The most common one, and understandable. Revenue is real, existentially important, and easy to measure. But it’s a lagging indicator, it tells you what happened, not what will happen. By the time revenue signals trouble, the customers causing the trouble have already churned or disengaged. A north star that predicts revenue, rather than records it, gives you a window to act while there’s still time.
“We need one number for the whole company, forever.” The north star should be durable, but it isn’t permanent. Amplitude moved from Weekly Querying Users to Weekly Learning Users as their business evolved, not because the first metric was wrong, but because their understanding of what customer value actually meant had deepened. A north star is the right measure for your current model and your current value proposition. If either changes significantly, the metric should probably change too.
“The north star metric replaces all other metrics.” No business runs that way. The north star is the organizing principle for your supporting metrics, not a replacement. You still watch revenue, track costs, monitor churn, measure channel performance. The north star tells you whether the system is working at the level of customer value. Everything else tells you how different parts of the system are performing in support of that.
“If we can’t track it perfectly, it’s the wrong metric.” Operators sometimes reject the right north star because it’s harder to measure than something a dashboard already shows. A fitness studio whose north star is “members who attend eight or more sessions per month” might have to export a spreadsheet from their booking system rather than see it in a live graph. That’s fine. Imperfect measurement of the right thing beats perfect measurement of the wrong thing, every time.
“It’s a product concept, not relevant to my marketing.” Because it came from product management circles, it gets filed as a tech tool. But it’s a clarity tool. A marketing team with a north star knows which campaigns to run, the ones that bring in customers who achieve north star behavior fastest, not just customers who convert at the lowest CPA. A sales team with a north star knows which leads to prioritize. It touches every function.
Common Mistakes
- Running the north star as a reporting number instead of a decision filter — Every week, ask one question about the number: what did we do differently that moved it, or why didn’t it move? If nobody can answer that, the metric isn’t connected to decisions, it’s just being watched. The fix is to assign ownership of each input metric to a specific person, so the north star conversation always has a “who’s responsible for this lever” built into it.
- Picking the metric before looking at customer data — Most operators brainstorm their north star in a meeting and then go looking for data to confirm the choice. Do it the other way around. Pull a cohort comparison, your highest-LTV customers versus customers who churned in year one, and look for the behavior that separates them in their first 30 days. That behavior is almost always a better north star than anything a meeting produces.
- Announcing it once and walking away — A north star without a cadence dies in week three. Build a weekly ritual, even five minutes at the start of a team meeting, where the north star number and its two or three key inputs get read out loud. Saying the number in a room together is different from everyone silently having access to a dashboard. The conversation is where the diagnosis happens.
- Tying it to bonuses or performance reviews — Once a metric becomes a compensation target, people optimize the number rather than the behavior behind it. That’s Goodhart’s Law, and it’s reliably lethal to clean measurement. Keep the north star as a diagnostic tool. Attach compensation to revenue and customer outcomes, not to the signal you’re using to predict them.
- Treating it as permanent and never revisiting it — Amplitude moved from Weekly Querying Users to Weekly Learning Users as their product strategy matured, not because the first metric was wrong, but because their understanding of customer value deepened. Schedule an annual north star review. Ask: does this metric still reflect what our best customers actually get from us? And is there a behavior that predicts retention even earlier than our current metric does? If yes to either, update it.
Operator’s Take
Most write-ups stop at the picking. That’s the easy part. What actually changes how a business runs isn’t finding the number, it’s building the muscle to use it as a decision filter rather than a reporting ornament. So here’s what I’d actually do, in sequence, if I were dropping this into a real operation.
Start with a cohort pull, not a brainstorm. Pull your last 90 days of new customers. Sort by who’s still active, who bought again, who referred someone. Look at what behavior they shared in their first 30 days. Don’t theorize, look. In most businesses, one or two behaviors separate the retained customers from the churned ones with uncomfortable consistency. That pattern is where your north star lives. The brainstorm comes after you’ve looked at the data, not before.
Then flip your channel analysis. Most operators think about acquisition in terms of cost, which channel has the lowest CPA. The north star flips that question. The right question is which channel delivers customers who hit north star behavior fastest. You’ll almost always find that one or two channels are quietly doing most of the real work, and that one or two channels that look efficient on CPA are delivering customers who disappear inside 60 days. That single finding redirects budget more reliably than any campaign optimization. Pull the data, map it to your north star behavior, and let it tell you where to concentrate.
Build a five-minute weekly ritual before you build anything else. Not a dashboard. Not a reporting deck. A five-minute slot at the start of a standing meeting where someone reads the north star number out loud, then reads the two or three inputs. Then the room talks about it. That’s it. The conversation is where the diagnosis happens, not in a tab nobody opens. I’ve seen teams with beautiful dashboards that never change behavior, and teams with a whiteboard number that shifts every decision they make. The ritual is the thing.
Use it to simplify hiring and handoffs. When you can say clearly, “this is the one thing our business exists to move,” onboarding gets shorter and briefs get sharper. A contractor, a new hire, a freelance designer, they either connect their work to the north star or they don’t. That’s a much cleaner conversation than trying to explain a twenty-metric dashboard to someone on their first week. If someone can’t articulate how their role touches the north star after two weeks, that’s a coaching conversation worth having early.
Protect the signal from Goodhart’s Law. The single fastest way to break a north star metric is to attach a bonus to it. Not because people are dishonest, they’re not, but because any metric tied to a reward becomes the thing people optimize directly, rather than the behavior behind it. I’ve watched this happen. The north star number looks great and the business quietly gets worse. Use it as a diagnostic floor, below which the business has a problem worth a real conversation, not a ceiling you celebrate hitting. Keep compensation attached to revenue and outcomes, not the signal you’re using to predict them.
On AI: tools like ChatGPT or Claude are genuinely useful for one specific step, generating candidate metrics fast. Describe your business model, your best customers, your worst churn patterns, and ask for a list of potential north stars. Twenty candidates in five minutes instead of wrestling with a blank page. But no model can tell you which candidates are real. That requires knowing which of your customers are actually happy, which churned, and what behavior separated the two groups before they left. That pattern lives in your data and your gut, not in the model. Use AI to expand the list; use your own numbers to narrow it. The judgment stays with you.
One last thing. Be careful about borrowing the north star of a company you admire. “Hours watched” made sense for Netflix at a specific stage of their content strategy. If you run a video course platform and anchor on hours watched, you might end up optimizing for long videos over effective ones, and miss that your students would rather finish a tight 20-minute lesson than wade through a padded 90-minute one. Famous examples are illustrations, not prescriptions. Your north star has to come from your customers, your data, and an honest answer to what you actually deliver.
Used in
- ✓ Build a Complete Marketing Department
Used to identify the right diagnostic metric that governs campaign prioritization and channel investment decisions, ensuring marketing spend chases north star behavior, not just clicks. - ✓ The Missing Manual for FunnelKit
Applied when setting up automation sequences and conversion goals, the north star metric defines what a successful funnel journey actually looks like, beyond the sale. - ✓ The Missing Manual for Make
Used to define the trigger events for automated workflows, when a customer achieves north star behavior, Make can fire the retention, upsell, or referral sequence that compounds that value.
FAQ
How is a north star metric different from a KPI?
KPIs are a category of measurement, a business can have dozens of them. A north star metric is one specific KPI elevated above all others because it most directly reflects whether customers are getting the value your business promises. It organizes and contextualizes the rest of your KPIs rather than competing with them.
Can a small business with just a few employees use a north star metric?
Absolutely, and arguably it’s more valuable the smaller you are, because small teams can’t afford to chase multiple competing priorities. One clear north star replaces a lot of noisy disagreement about what to focus on next.
How often should we review our north star metric?
Weekly for the inputs; monthly for the north star itself; annually to ask whether the metric still reflects your core value proposition. The inputs need high-frequency attention because they’re where your team’s daily decisions actually live.
What if my business model makes it hard to measure customer value directly?
Look one step upstream from revenue. Repeat purchase, referral within 90 days, renewal without a discount conversation, unsolicited positive review, all of these are measurable proxies for delivered value that don’t require a data warehouse. Imperfect measurement of the right behavior beats perfect measurement of the wrong one.
Should my north star metric change over time?
Yes, if your product, model, or customer value proposition changes significantly. It shouldn’t change quarterly, that defeats the stability the framework provides, but reviewing it annually and being willing to update it when your business evolves is healthy, not inconsistent.
Is it a problem if my north star metric can theoretically be gamed?
Any metric can be gamed if people are rewarded for the number rather than the behavior behind it. The safeguard is to use the north star as a diagnostic tool, not a performance target. Review it with curiosity, not as a scorecard, and pair it with input metrics that make gaming obvious.
Further reading
- The North Star PlaybookAmplitude (free, available at amplitude.com): the most practical structured guide to the framework, including workshop templates for finding your metric and mapping its inputs. Co-authored by product evangelist John Cutler.
- Hacking GrowthSean Ellis & Morgan Brown (2017): Ellis lays out the growth hacking movement that spawned the north star concept; most useful for understanding where the metric fits inside a broader growth system.
- Lean AnalyticsAlistair Croll & Benjamin Yoskovitz (2013): introduced the ‘One Metric That Matters’ concept that influenced the north star framework; valuable for understanding how to sequence metrics at different stages of a business.
Sources:
Sean Ellis, GrowthHackers.com, source of Ellis’s direct definition of the north star metric; Amplitude North Star Playbook, co-authored with John Cutler (amplitude.com/books/north-star), source for Weekly Learning Users definition and input-metric framework; Amplitude blog, We’re Evolving Our Product’s North Star Metric (amplitude.com), source for Amplitude’s documented progression from Weekly Querying Users to Weekly Learning Users; Kieran Flanagan, VP of Marketing and Growth at HubSpot, Inside Intercom Podcast (intercom.com), source for HubSpot’s weekly active teams north star disclosure; OpenView Partners, HubSpot’s Journey from MQL to PQL (openviewpartners.com), source confirming HubSpot’s subsequent evolution away from Weekly Active Teams; John Cutler, North Star Playbook (amplitude.com), source for Cutler’s direct explanation of the WLU definition and the reasoning behind it; Mixpanel, ‘What is a North Star Metric’ (mixpanel.com); CXL Institute, ‘Finding Your North Star Metric’ (cxl.com); Reforge, ‘Don’t Let Your North Star Metric Deceive You’ (reforge.com); Simon-Kucher Global Telecommunications Study 2025 (simon-kucher.com), source for operator metric-misalignment findings.
Brian Kasday spent forty years in direct-response marketing before rebuilding the whole operation as a one-person shop. He writes The Operator’s Library — including “Build a Complete Marketing Department” — for operators who’d rather build it themselves than wait on someone else.
Build the department these ideas describe — the free companion kit: mmsvegas.com/resources.
More The Operator's Canon guides
Free · Operator Toolkit
Want the tools, not just the guide?
Get the free operator toolkit — templates and checklists for the systems you actually run, plus a note when this guide changes.
Get the free toolkit →How to cite: North Star Metric. Associated with Sean Ellis / Amplitude North Star Playbook. The Operator’s Canon, MMS Vegas. https://mmsvegas.com/library/north-star-metric-explained/