
Last updated: July 2026
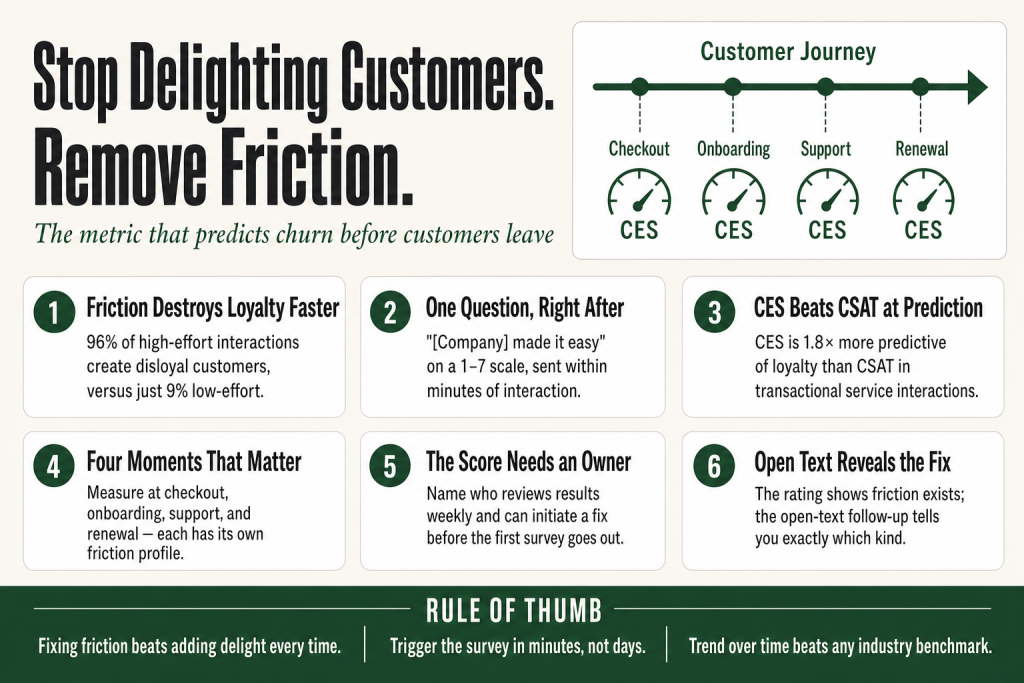
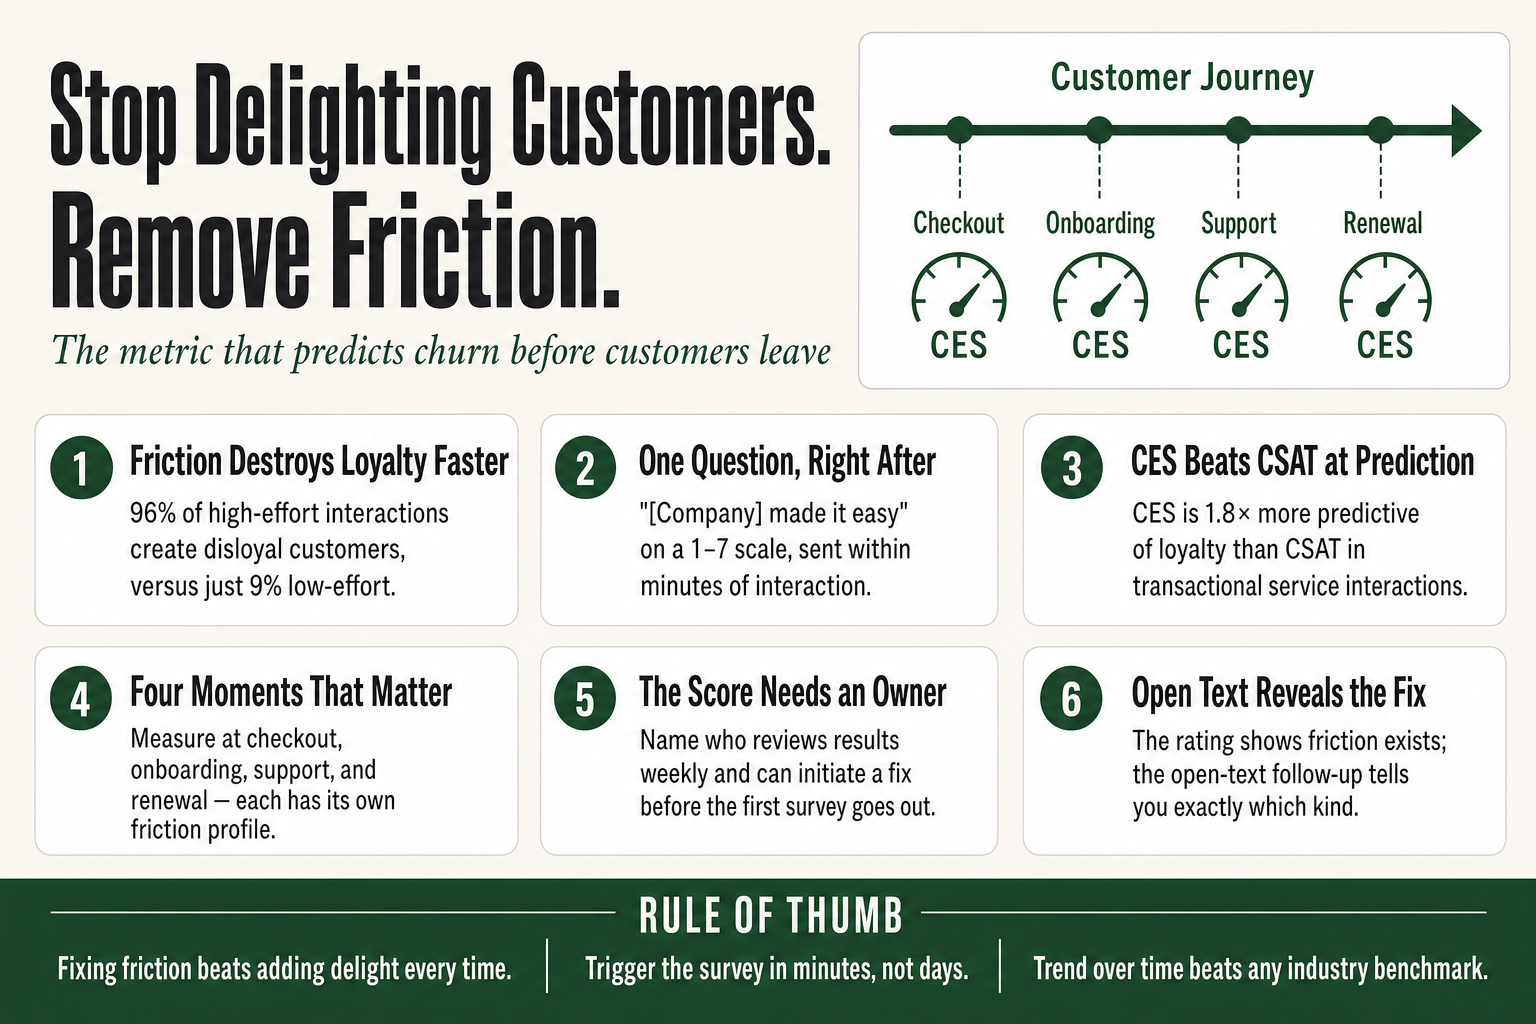
Customer effort score is the metric that answers the one question your customers are asking silently every time they interact with your business: how hard did I have to work for this? It gives you a way to identify the specific points in your buying, onboarding, support, and renewal experience where customers are quietly burning out, and a straightforward method to measure and close those gaps before they turn into cancellations or lost sales.
Make it easy to do business with you, and people will keep doing business with you. That sounds obvious until you look at where most operators actually spend their improvement budgets, on wow moments, surprise upgrades, and delight campaigns, while the busted mobile checkout and the three-email onboarding loop sit there quietly bleeding customers. The research behind CES was disruptive precisely because it put numbers to that misallocation. The problem most businesses had wasn’t a deficit of memorable moments. It was an excess of unnecessary friction that nobody had bothered to measure.
For a small operator, that’s actually good news. You don’t need a bigger budget to fix friction. You need visibility into where it’s hiding.
The idea in 30 seconds
- Customer effort score measures how easy, or hard, a specific interaction with your business felt to the customer. One question, triggered right after a touchpoint.
- The counterintuitive finding that launched CES: delighting customers doesn’t build loyalty nearly as reliably as removing friction does. High effort actively creates disloyalty.
- In transactional service interactions, CES is a stronger predictor of customer retention than CSAT or NPS, it also points directly at what to fix, which those two metrics don’t.
- Measure it at four moments: buying/checkout, onboarding, support, and renewal. Each has its own friction profile and its own fix.
- The 2.0 question format: “[Company] made it easy for me to handle my issue” on a 1 to 7 agreement scale. Simple, fast, consistent.
- CES doesn’t replace NPS or CSAT, it completes the picture. Use CES to find what to fix; use NPS to know whether fixing it moved your relationship score.
Where Customer Effort Score Came From
For most of the 2000s, the dominant customer service playbook centered on one idea: exceed expectations. Delight the customer. Go above and beyond. The logic seemed airtight, happy customers come back, unhappy ones leave, so aim for happiness and then some.
The problem was that nobody had rigorously tested whether exceeding expectations actually drove loyalty better than simply meeting them. Three researchers at the Corporate Executive Board, Matthew Dixon, Karen Freeman, and Nicholas Toman, ran that test. Their study analyzed more than 75,000 customer interactions and found that reducing customer effort was far more effective at driving retention than trying to delight customers. The paper landed in Harvard Business Review in July 2010 under the title “Stop Trying to Delight Your Customers.”
The original question asked customers to rate how much effort they personally had to put in, on a five-point scale. That framing had problems, respondents didn’t interpret the self-assessment consistently, and the word “effort” translated poorly across languages. In 2013, CEB introduced CES 2.0: a shift to a statement format on a seven-point agreement scale, placing accountability on the company rather than asking customers to judge themselves. Dixon, Toman, and Rick DeLisi expanded the framework in The Effortless Experience that same year. That’s the version in use today.
The Core Idea: Friction Is the Enemy, Not Mediocrity
Customer loyalty isn’t a positive you build, it’s a negative you avoid destroying. The CEB research found that 96% of customers who experience high-effort interactions become disloyal, compared to just 9% of those with low-effort interactions. That 87-percentage-point gap is your churn risk, sitting in plain sight.
That asymmetry has a practical implication most operators underweight. You get very little credit for delighting someone at a touchpoint where they’re already satisfied. But a single high-friction interaction, a confusing returns process, an onboarding flow that requires three back-and-forth emails, a checkout that dies on mobile, can undo months of goodwill. Fixing a painful process returns more to loyalty than adding a surprise freebie.
Customers aren’t keeping a running tally of your great moments. They’re mostly coasting on a vague background sense that doing business with you is either easy or a bit of a hassle. The moment they consciously notice the hassle, the relationship starts to wobble. CES is the instrument that catches wobbles before they become cancellations.
The metric is deliberately narrow. CES measures whether a specific task felt easy. That’s all. That specificity is a feature, not a limitation, it means when your score drops, you know roughly where to look. CSAT tells you whether someone was satisfied with a moment. NPS tells you whether someone would recommend you. CES tells you whether they had to work harder than they should have. Different questions, different answers, all useful.
The CEB research also found that moving a customer from the low end of the 7-point scale up toward the middle does most of the loyalty work. Getting from “painful” to “fine” captures the bulk of the retention benefit. Getting from “fine” to “magical” adds very little on top. The returns on effort reduction are front-loaded, which means even a partial fix on your worst friction point is worth more than a polish on something already working.
How to Actually Measure Customer Effort Score
The mechanics are straightforward. You send a one-question survey immediately after a customer completes a meaningful task. The question follows the CES 2.0 format: something along the lines of “[Your company] made it easy for me to handle my issue today”, adapted for context as needed. “[Company] made it easy for me to complete my purchase” at checkout. “How easy was it to get started with us?” after onboarding. Customers respond on a 1 to 7 scale: 1 is “strongly disagree,” 7 is “strongly agree.”
On that scale, a score of 5 or higher is generally considered solid, with 5.5 representing the current industry average across most sectors. Anything below 4 signals significant friction and real churn risk. The most useful benchmark isn’t your industry’s average, it’s your own score last quarter. Improvement over time beats methodological perfection on day one.
Timing matters as much as the question itself. Send the survey within minutes of the interaction, a post-ticket email, an in-app trigger after onboarding completion, a receipt-page survey after checkout. The further out you send it, the more you’re measuring a customer’s memory of the experience rather than the experience itself.
Always add one open-ended follow-up. Something like: “What was the most frustrating part?” or “What could we have made easier?” The rating gives you the score. The follow-up gives you the context to act on it. Stop there, adding more questions increases abandonment and produces noisier data.
On calculation: the most common modern method is the percentage of “easy” responsesthe share of respondents who score 5, 6, or 7. That’s also the format preferred for communicating results to teams and leadership because it’s intuitive: “74% of customers found our support easy this month.” Some teams prefer the simple mean (sum of all scores divided by total responses). Either works. Pick one and never change it mid-program.
Four Touchpoints Worth Measuring
CES originated in customer support but applies to any discrete customer task, onboarding, purchase, returns, billing inquiries, feature adoption, and complaint resolution. In practice, four moments carry the most weight for a small operator:
- Checkout/purchase: Cart abandonment is visible; friction before purchase often isn’t. A CES survey on your confirmation page tells you whether the path to “buy” felt easy or annoying. A low checkout score almost always points to UX or payment friction, too many steps, a confusing coupon field, a mobile layout that doesn’t cooperate.
- Onboarding: This is where you lose customers before they’ve ever had a chance to get value. High-effort onboarding is one of the leading drivers of early churn, and the fix is usually simpler than it looks. Better sequencing. A short video for the thing people always call about. A checklist that tells people what “done” looks like.
- Support: The original home of CES and still the most critical. Reducing effort in support not only increases loyalty, it reduces repeat contacts, escalations, and channel switching, which means it cuts your support costs at the same time it lifts your retention.
- Renewal/billing: Especially relevant for subscription or retainer businesses. If the renewal process involves confusion, extra steps, or invoice ambiguity, customers who were otherwise satisfied start weighing the switching cost against the hassle cost. A low CES here can signal churn risk weeks before a renewal date, which gives you a real window to intervene.
Segment your CES data by touchpoint and customer type. A poor onboarding score from new customers might point to documentation gaps rather than a product problem. A poor support score on phone versus chat might be a channel-routing issue, not a people issue. The same friction can look very different depending on where and how you look at it.
CES, NPS, and CSAT: Which One Tells You What
These three metrics confuse a lot of operators, mostly because vendors often pit them against each other. They’re measuring three genuinely different things.
CSAT measures emotional sentiment, how satisfied was a customer with a specific interaction? CES measures friction, how easy was it to complete a specific task? NPS measures relationship health, how likely is this customer to recommend you to someone else? Different questions. Different predictions. Different uses.
NPS is your altimeter, it shows overall relationship health but doesn’t tell you which engine is losing power. CSAT is a temperature reading, useful for a specific moment, but it doesn’t predict whether someone comes back. CES is your oil pressure warning light, narrow, immediate, and when it blinks, you know exactly where to look.
The CEB research, later carried forward by Gartner, found that CES is 1.8 times more predictive of customer loyalty than CSAT, and twice as predictive as NPS, specifically for transactional service interactions. That predictive edge holds in service and transactional contexts, the support ticket, the checkout, the onboarding session. It doesn’t mean CES out-predicts NPS for gauging overall relationship health or referral intent, where NPS is still the right tool.
The practical play for a small operator: track CES and CSAT after meaningful interactions to monitor quality and ease, then run NPS surveys periodically to see whether those improvements are moving the broader relationship. If your CES scores are improving and your NPS isn’t, friction wasn’t the main loyalty driver, look at product, price, or relationship depth instead.
Putting this to work? The ideas in the Canon are the foundation under the tactical playbook in Build a Complete Marketing Department — grab the free companion kit at mmsvegas.com/resources.
Customer Effort Score in Practice: Real Operators, Real Friction
The companies that have applied CES most effectively didn’t use it to generate a number for a board deck. They used it to build a friction audit, a prioritized list of the things customers are working too hard to accomplish, ordered by frequency and cost.
Red Hat amended its CES survey to let customers supply richer information when opening support cases, including business impact, number of users affected, and urgency level. That gave the support team better triage data upfront, cutting back-and-forth and reducing contacts per issue. Small process change, large downstream effect. Healthcare insurer Blue KC shifted its focus to CES and drove measurable improvements in both service delivery and business outcomes, the kind of case where reducing effort at one touchpoint tends to lift adjacent metrics because the friction annoying your customers is usually the same friction slowing your support team down.
For a smaller operator, the equivalent moves are rarely exotic. They tend to be things like:
- A three-step account creation flow reduced to one click via Google sign-in.
- A PDF manual replaced with a three-minute video for the one thing customers call about most.
- An invoice that required a phone call to understand, redesigned to be self-explanatory.
- A return process that required a phone call, replaced with a form link in the order confirmation email.
None of those require a developer sprint or a consultant. They require knowing where the friction is, and that’s exactly what a well-run CES program surfaces.
The open-text response is often worth more than the numeric score. When 40% of customers answering “what made this difficult?” write some version of “I couldn’t find where to…,” you have a navigation fix. When they say “I had to contact you twice,” you have a first-contact resolution problem. The score tells you that friction exists. The text tells you what kind.
A SaaS operator running CES across touchpoints might see a healthy 84% easy-rate in post-support interactions and a respectable 79% at checkout, but only 48% in onboarding completion. The headline CES looks fine. The onboarding CES is a fire. That’s exactly the kind of signal you’d miss if you were only running an aggregate NPS survey once a quarter.
Where CES Works Best
CES earns its keep in businesses where transactions repeat, where customers self-serve, and where support interactions are a regular part of the relationship. SaaS and subscription businesses, professional service firms with ongoing retainer clients, e-commerce stores with active repeat buyers, and B2B operations where the customer has to interact with your systems regularly, these are the natural homes for CES.
It maps especially cleanly to journeys with discrete, measurable steps. Onboarding has a start and an end. A support ticket has an open and a close. A checkout has a cart and a confirmation page. Each is a moment you can trigger a survey against.
CES also works unusually well as an early warning system. It catches problems before customers leave, that lead time is the whole value. By the time a customer churns or leaves a negative review, the friction has already won. A low CES score two months before a renewal date gives you a window to intervene: a personal check-in call, an offer to clean up their setup, a process fix before the next touchpoint.
For B2B operators specifically, the word-of-mouth risk from high-effort interactions is real. Research shows that 81% of customers who had to exert significant effort say they intend to speak negatively about the company to others. In a small market where reputation compounds, that’s not a theoretical cost. It’s a lost referral and a live warning in a LinkedIn post.
Where CES Falls Short
CES is a transactional metric. Full stop. It tells you whether a specific task felt easy. It does not tell you whether the customer loves you, whether they’ll refer you, whether they’d pay more for you, or whether they’re at risk because a competitor just offered something better. A customer can have a perfectly effortless support interaction and still switch because the product doesn’t do what they need. CES doesn’t capture brand equity, emotional loyalty, or the cumulative weight of a long-term relationship. Use it as the transactional instrument it is.
A few specific contexts where CES is the wrong primary lens:
- Luxury and premium positioning: Some customers expect to work a little for the experience, the exclusive membership application, the made-to-measure consultation, the VIP onboarding call. Too much ease can actually cheapen the brand perception. CES measures effort; it can’t distinguish between friction that annoys and friction that signals exclusivity. Use it carefully here, and never in isolation.
- Low-frequency, high-stakes purchases: If you’re selling something a customer buys once every five years, home renovation, commercial equipment, financial planning, you won’t accumulate enough data points to see a trend. A single annual NPS survey is more useful.
- Emotional or relational services: Therapy, executive coaching, grief counseling, the value often comes from being challenged. “How easy was your session today?” is not a meaningful question when productive difficulty is the point.
CES also loses value when you’re inconsistent with question phrasing or scale, or when you fail to follow up with open-text context. A score of 3 can mean very different things depending on who’s responding and what they were trying to do. That’s why CES works best alongside qualitative context, not as a standalone dashboard number.
One more caveat worth stating plainly: the 96% disloyalty figure comes from the original CEB study and has not been replicated at precisely the same magnitude in every context. Some CX researchers also note that the original methodology relied on self-reported loyalty intentions rather than observed repurchase behavior. The directional truth, that high-effort interactions create disloyal customers at a dramatically higher rate than low-effort ones, has been confirmed broadly. Treat the headline statistic as a signal, not a law of physics.
What Operators Get Wrong About Customer Effort Score
Misunderstanding 1: CES tells you whether customers are happy. It doesn’t. It tells you whether a task felt easy. A customer can complete your checkout smoothly, score you a 7, and still find your product disappointing. Ease and satisfaction are correlated, but they’re not the same thing. If you’re only running CES, you’re measuring one dimension. Pair it with CSAT at the interaction level and NPS at the relationship level to get the full picture.
Misunderstanding 2: A high aggregate CES score means your journey is working. Not necessarily. An overall easy-rate of 80% can hide a specific touchpoint, say, onboarding, sitting at 45%. Aggregating across touchpoints before you’ve validated each one individually is how you miss the fire. Segment first. Aggregate later, if at all.
Misunderstanding 3: You can meaningfully benchmark your CES against industry averages. Only loosely. The industry average on a 7-point scale hovers around 5.5 across most sectors, but small changes in question wording produce meaningfully different score distributions, which makes external benchmarking unreliable unless you’re using the exact same question format as the source data. Your own trend over time is the benchmark that matters.
Misunderstanding 4: CES is a support team metric, so it goes to the support team. That’s where it was invented, but CES data that never leaves the support queue is wasted. The most valuable CES insights are cross-functional: a low onboarding CES is probably a product or documentation problem, not a support problem. A low checkout CES is a UX problem. Route the data to the team that owns the fix, not just the team that owns the survey.
Common Mistakes
- Measuring CES only in support and calling it done — Support is where CES was invented, not where it lives. Deploy surveys at checkout, onboarding, and renewal too, each touchpoint has its own friction signature. A healthy support CES can mask a catastrophic onboarding score; you won’t know until you look.
- Batching surveys instead of triggering them immediately — Sending CES in a weekly digest or daily batch measures memory, not experience. Wire the trigger to the event itself, ticket close, onboarding milestone, purchase confirmation. The survey needs to land within minutes or the signal degrades.
- Skipping the open-text follow-up because it’s harder to quantify — The number tells you friction exists. The open text tells you which kind. ‘I had to call twice’ is a first-contact resolution problem. ‘I couldn’t find where to…’ is a navigation problem. These are different fixes. Without the follow-up question, you’re treating symptoms instead of causes.
- Changing the question wording when scores plateau — The impulse to refresh the survey phrasing when numbers stagnate is understandable and wrong. Small wording changes produce meaningfully different score distributions and break your trend line. Standardize the exact phrasing on day one. If your score is stuck, look at the process, not the question.
- Launching CES without naming an owner before the first survey goes out — Before you send a single survey, put a name next to ‘reviews results weekly and has authority to initiate a fix.’ CES data without an accountable owner is a dashboard nobody acts on, and within two quarters, it becomes one of those metrics that lives in a report nobody opens.
Operator’s Take
Walk your own customer journey before you instrument anything. Not a staged demo. Not logged in as an admin who can see every menu. Buy from your own website on a phone you’ve never used before, submit a support request through your actual contact form, try to figure out your onboarding without anyone walking you through it. Most operators who do this for the first time find three to five genuinely embarrassing friction points they’d stopped noticing. The customers knew. They told you with their silence and their churn. You just didn’t have a score attached to it.
Once you’ve walked the journey yourself, you’ll have an instinct for what’s broken. Fix the obviously broken thing first, you don’t need a survey for that. Then run CES, because the second layer of friction only becomes visible in aggregate. A single complaint about your checkout coupon field is noise. Forty consecutive customers writing “I couldn’t find where to enter my discount code” is a conversion problem with a five-minute fix.
My honest take on where operators misuse CES: they start too broad, then lose interest when the data doesn’t immediately tell them anything actionable. The answer isn’t more touchpoints or a fancier tool. It’s two touchpoints, done well, with a named owner reading results weekly. Start post-support and post-onboarding. Not because those are theoretically important, because those are where the two most common failure modes live: customers who couldn’t get their problem solved without extra contacts, and customers who never figured out how to get value before they gave up.
Post-support wiring: Trigger the survey the moment a ticket closes, not 24 hours later, not in a weekly batch. Zendesk, Help Scout, and Intercom all have native survey triggers; use them. The question: “[Company] made it easy for me to resolve my issue today.” Follow it with: “What, if anything, made this harder than it should have been?” Read every open-text response yourself for the first 90 days. Patterns emerge within two to three weeks. They almost always fall into one of three buckets: the customer had to contact you more than once for the same issue (add a resolution-confirmation step to your ticket-close email and review why tickets reopen); they couldn’t find your support channel without hunting (move the support link above the fold, test it on a fresh browser with no cookies); or they waited without status updates (a single automated “we got your request, expect a reply within X hours” email eliminates a surprising volume of anxious follow-up contacts and costs nothing to set up in any helpdesk).
Post-onboarding wiring: Trigger the survey when your system confirms a customer hit your defined onboarding milestone, not when you think they should be done, when the CRM or product analytics confirms they actually are. The question: “[Company] made it easy to get started.” Follow-up: “What was the most confusing part?” If more than 20% of respondents name the same step, that step needs a tooltip or a two-minute Loom recording, not a product redesign. Operators regularly fix a 48% onboarding CES in six weeks by adding three short videos to their welcome email sequence. No developer required.
On tooling: Typeform, Delighted, or native helpdesk survey features all work. The key isn’t which one, it’s automation. The manual version, where someone on your team sends surveys by hand, dies within two months every time. Automate the trigger at the moment of interaction or don’t bother.
Add checkout and renewal CES once you have rhythm at those first two, and, critically, once you have a named owner for acting on the data. Before you launch any CES program, put a name next to “reviews results weekly and can initiate a fix.” A dashboard without an owner is just a more expensive way to feel busy.
One thing CES won’t do: tell you whether the product itself is the problem. If your onboarding CES improves and churn doesn’t budge, the friction wasn’t the issue, the product is. CES is a signal about the experience of using what you sell, not about whether what you sell is worth using. Don’t let a good CES score make you complacent about the underlying offer.
Report CES this way inside your business: not “our score is 5.8” but “our post-support CES is 5.8, up from 5.1 last quarter, and the top friction item this month was customers not knowing their ticket was resolved until they re-contacted us, we’re shipping a resolution notification email next week.” That’s a useful update. The bare number is noise.
The connection to Strategy of Preeminence is worth naming. Jay Abraham’s core argument is that you earn the position of most trusted advisor by genuinely acting in your client’s best interest. Removing friction is one of the most concrete operational expressions of that. A client who never has to fight with your invoicing system, your onboarding flow, or your support queue isn’t just satisfied, they’re not looking for a reason to leave. That’s the retention floor CES helps you build.
Used in
- ✓ Build a Complete Marketing Department
Used to design the post-purchase and retention phases of the customer journey, specifically identifying which touchpoints in onboarding, support, and renewal are leaking customers due to avoidable friction. - ✓ The Missing Manual for FunnelKit
Applied to evaluate and optimize checkout flows and post-purchase sequences, using CES logic to reduce form fields, step count, and cognitive load at the moment of conversion. - ✓ The Missing Manual for Make
Used to automate CES survey delivery at key touchpoints, triggering post-support and post-onboarding surveys via workflow so measurement is consistent without requiring manual effort from the team.
FAQ
What is a good customer effort score?
On a 1 to 7 scale, a score of 5 or higher is generally considered solid, with 5.5 representing the current average across most industries. Anything below 4 signals significant friction risk. More important than any single number is your own trend over time, improving quarter-over-quarter matters more than where you sit against industry averages.
How is customer effort score calculated?
The two most common methods are the simple mean (sum of all scores divided by total responses) and the percentage of ‘easy’ responses (share of customers scoring 5, 6, or 7 on the 7-point scale). Pick one method and never change it, consistency matters more than which formula you choose.
How often should I send a CES survey?
CES is an event-triggered metric, not a periodic one. Send it within minutes of each qualifying interaction, after a support ticket closes, after onboarding completes, after a purchase confirms. Don’t batch them into weekly or monthly sends.
What’s the difference between CES and NPS?
CES is transactional, it measures whether one specific task felt easy. NPS is relational, it measures overall brand loyalty and referral intent. Use CES to find and fix friction; use NPS to see whether fixing that friction is moving the broader relationship.
Does customer effort score work for small businesses?
Yes, and often better than for large enterprises, small operators can act on friction findings in days rather than quarters. Even a simple post-support email with one question and one open-text field, routed to the owner, produces actionable intelligence within weeks.
Can I use CES for my checkout or e-commerce flow, not just support?
Absolutely. CES originated in support but applies to any discrete customer task, purchasing, onboarding, billing, returns, or renewal. Adapt the question to the context: ‘[Company] made it easy for me to complete my purchase’ works just as well as the support variant.
Further reading
- Matthew Dixon, Nick Toman, Rick DeLisi, The Effortless Experience (2013): The source material for most of what the industry now calls CES best practice. Read it for the full framework; the chapters on channel steering and next-issue avoidance are particularly useful for operators running support teams.
- Dixon, Freeman & Toman, “Stop Trying to Delight Your Customers,” HBR July, August 2010: The original paper. Short enough to read in one sitting. Worth going back to the source because the nuance in the original research, especially the specific conditions under which delight does and doesn’t drive loyalty, gets lost in almost every secondhand summary, including this one.
Sources: Matthew Dixon, Karen Freeman, and Nicholas Toman, “Stop Trying to Delight Your Customers,” Harvard Business Review, July, August 2010. Matthew Dixon, Nick Toman, Rick DeLisi, The Effortless ExperiencePortfolio/Penguin, 2013. Gartner (formerly CEB Global), CES 2.0 methodology documentation. MeasuringU, “10 Things to Know about the Customer Effort Score” (notes on predictive validity caveats). Supporting data from Merren, Fullview, Ratenow, Stealthagents, Cleartouch, NiceReply, Help Scout, Gainsight, and InMoment research summaries (all accessed June, July 2025).
Brian Kasday spent forty years in direct-response marketing before rebuilding the whole operation as a one-person shop. He writes The Operator’s Library — including “Build a Complete Marketing Department” — for operators who’d rather build it themselves than wait on someone else.
Build the department these ideas describe — the free companion kit: mmsvegas.com/resources.
More The Operator's Canon guides
Free · Operator Toolkit
Want the tools, not just the guide?
Get the free operator toolkit — templates and checklists for the systems you actually run, plus a note when this guide changes.
Get the free toolkit →