
Last updated: July 2026
Customer lifetime valueLTV, CLV, whatever acronym your industry prefers, is the single number that transforms your marketing budget from a coin flip into a calculated bet. By the end of this page, you’ll be able to calculate a working LTV for your business on a napkin, set a defensible acquisition budget from it, and identify the fastest levers to raise it, so you stop competing on who has the cheapest leads and start competing on who can afford to spend more to win the right customers.
Here’s the uncomfortable reality most operators never sit with: the question “how much should I spend on ads?” has no honest answer without customer lifetime value. You can’t set a Google Ads budget, a referral bonus, a salesperson’s commission ceiling, or a free-trial offer without knowing what a won customer is actually worth over time. Yet most small businesses make those calls every week on nothing more than gut feel and last month’s cash balance.
LTV changes the frame. Instead of “how do I get cheaper leads,” the question becomes “how do I make each customer worth more?” That’s a far more tractable problem, and one where a small operator can out-maneuver a bigger competitor who’s only watching cost-per-click.
The idea in 30 seconds
- Customer lifetime value (LTV) is the total gross profit a customer generates over the entire relationship, not just the first sale.
- Knowing your LTV tells you exactly how much you can spend to acquire a customer and still win.
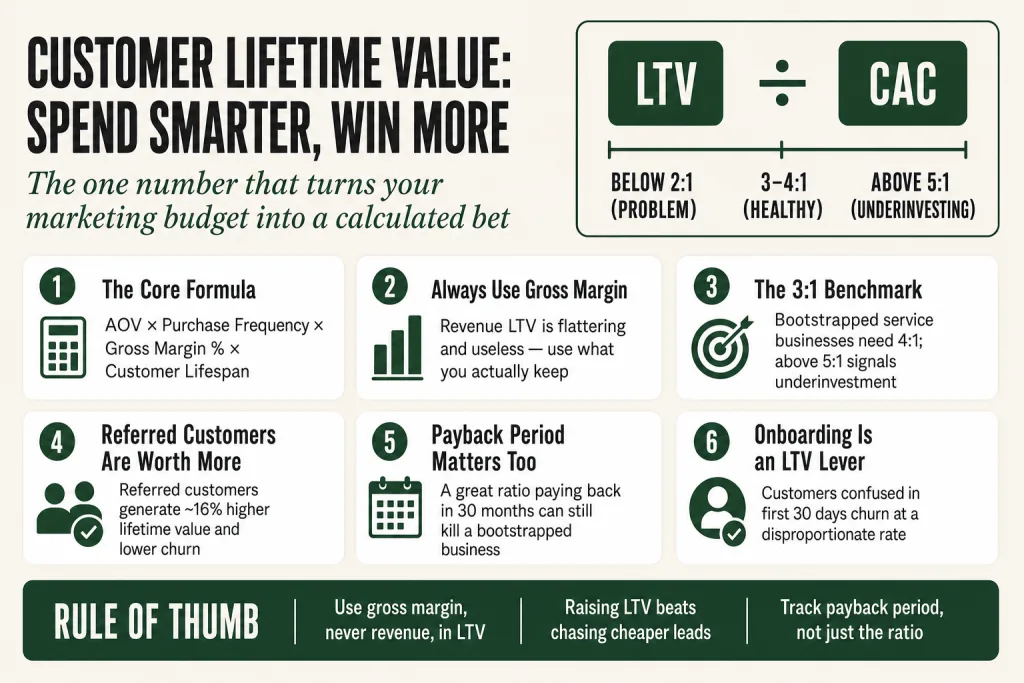
- The back-of-napkin formula: Average Order Value × Purchase Frequency × Gross Margin % × Customer Lifespan.
- The widely cited healthy benchmark is an LTV:CAC ratio of 3:1$3 back for every $1 spent acquiring a customer, a floor popularized by venture capitalist David Skok for mature SaaS companies, not bootstrapped service businesses, which need closer to 4:1.
- Raising LTV through retention, upsells, and referrals is almost always faster and cheaper than chasing lower acquisition costs.
- Without an LTV number, every ad-spend decision is a guess. With it, you have a ceiling you can bid up to, and still be profitable.
Where the Idea Came From
The instinct behind customer lifetime value predates the formal term by decades. Direct marketers were already sorting customers by long-run profitability in the 1980s, and the people doing the most rigorous work were Robert and Kate Kestnbaum. Their consultancy, Kestnbaum & Co., founded in 1967, the same year Lester Wunderman coined the phrase “direct marketing”, was credited with developing customer lifetime value as a working metric and applying financial modeling and econometrics to marketing decisions. Their first major clients included British Telecom and British Airways, and through that work they devised LTV and other financial models that had no real precedent in the field. Robert Shaw, who trained under the Kestnbaums, later extended their approach by adding campaign management, channel automation, and marketing analytics.
Shaw then co-authored Database Marketing: Strategy and Implementation with Merlin Stone in 1988. Wikipedia cites it as one of the first written accounts of the term “customer lifetime value,” complete with detailed worked examples. The record is clear enough: CLV as a defined concept with documented methodology traces to British database marketing in the 1980s, the Kestnbaums developed it, Shaw and Stone put it in print.
Jay Abraham and Dan Kennedy didn’t invent the concept, but they did something arguably more useful for small operators: they made it practical. Abraham’s framing of “marginal net worth” per customer, and Kennedy’s habit of building acquisition budgets backward from long-run customer value, spread LTV thinking to thousands of business owners who’d never heard of database marketing. That translation work matters.
The 3:1 LTV:CAC benchmark came much later. Venture capitalist David Skok of Matrix Partners popularized it around 2010 as part of his SaaS metrics framework, drawing on patterns he observed across mature public companies, HubSpot, Salesforce, NetSuite, with stable churn, multi-year customer lifetimes, and payback periods under 12 months. Skok gave a ratio the software industry could cite in pitch decks. Which it did, constantly, often in contexts it was never meant to fit.
The Problem LTV Actually Solves
The core problem is that most businesses account for marketing costs in one period and receive customer revenue across many periods. If you spend $300 to acquire a customer in January and they spend $150 in January, it looks like you lost money. If they spend $150 every quarter for three years, you made $1,500 gross on a $300 investment. Same customer, completely different story depending on which window you’re looking through.
Without LTV, operators default to measuring marketing by the first transaction. That creates a distorted picture that causes two opposite and equally damaging mistakes. The first is quitting on channels or campaigns that appear unprofitable but would pay off given more time. The second is doubling down on cheap-to-acquire customers who churn fast and never come back, customers who look great at day one and are disasters at month twelve.
LTV also solves a negotiation problem. When you sit down to set a Google Ads budget, negotiate an affiliate commission, or decide what to offer in a referral program, you need a ceiling, a number above which you’re giving away the store and below which you’re leaving growth on the table. LTV gives you that ceiling. Without it, every spend decision is a guess dressed up as a strategy.
There’s a softer problem it solves too. Operators who’ve internalized LTV think differently about customer relationships. They’re less likely to nickel-and-dime on service, less likely to let a customer churn over a fixable complaint, and more likely to invest in onboarding. The math makes the case for generosity in a way that “be nice to customers” never quite does on its own.
How to Calculate Customer Lifetime Value: The Back-of-Napkin Version
You don’t need a data science team. You need four numbers and ten minutes.
The working formula is:
LTV = Average Order Value × Purchase Frequency × Gross Margin % × Average Customer Lifespan
Walk through it with a real example. Say you run a residential landscaping business. Average job: $400. Customers book four times a year. Your gross margin, after labor, materials, fuel, is 45%. The average customer stays with you for three years before moving, switching, or stopping service.
LTV = $400 × 4 × 0.45 × 3 = $2,160
That’s your number. Not a guess anymore, it’s a floor. You can now make the following decisions with actual math behind them:
- You can afford to spend up to $720 acquiring a customer and still hit a 3:1 LTV:CAC ratio, meaning you earn roughly $3 in lifetime gross profit for every $1 spent acquiring a customer.
- If your current cost-per-acquired-customer is $200, you’re running at 10:1, which sounds great but may actually signal you’re underinvesting in growth.
- If it’s $900, you have a problem your gut already knows but your spreadsheet can now prove.
A few notes on doing this honestly:
Use gross margin, not revenue. Revenue LTV is flattering and useless. What matters is what you actually keep after direct costs. A business with $500,000 in revenue and 20% margins has the same LTV math as a business with $200,000 in revenue and 50% margins, but very different room to acquire customers. Revenue-based LTV calculations can overstate the real number significantly, leading to acquisition spend you genuinely cannot afford.
Customer lifespan is the tricky variable. If your business is young, you won’t have three-year data. Use what you have and be conservative. One honest proxy: divide 1 by your monthly churn rate. If you lose 5% of customers per month, average lifespan is 1 ÷ 0.05 = 20 months. Just know that this proxy has its own quirks, if you’re growing fast, recent churn can look worse than your actual long-run retention because new customers churn at higher rates than tenured ones. If you have no churn data at all, use comparable businesses in your category and revisit in six months.
Don’t blend what shouldn’t be blended. A landscaping business with residential customers and commercial property contracts probably has two very different LTVs. Run the numbers separately. One segment may justify a dedicated sales effort; the other may not.
Add referral value if your business earns it. If your average customer refers 0.5 new customers over their lifetime, and those customers carry the same LTV, your true LTV is 1.5× the formula result. Referral businesses, where word-of-mouth is the primary growth engine, are dramatically undervalued when you ignore this leg of the calculation.
The formula won’t be perfect. That’s fine. A directionally correct LTV number beats no LTV number by an enormous margin. You’re not building a financial model for a Series B pitch deck; you’re trying to make smarter decisions about where to put your marketing dollars next month.
The LTV:CAC Ratio, What a Healthy Business Actually Looks Like
Once you have your LTV, pair it with your Customer Acquisition Cost (CAC) and you have the most useful ratio in small-business marketing.
CAC = Total sales and marketing spend ÷ New customers acquired in the same period
Include everything in the numerator, ad spend, agency fees, your own time if you’re doing the selling, tools, CRM subscriptions. The most common mistake is counting only the ad invoice. Partial CAC makes the ratio look flattering and hides the real picture.
The 3:1 LTV:CAC benchmark, you earn $3 in lifetime customer profit for every $1 spent acquiring them, is the broadly cited floor for a healthy, self-sustaining business. There’s important context most people skip: venture capitalist David Skok of Matrix Partners popularized the 3:1 rule around 2010, drawing on his observations of mature public SaaS companies with stable churn, multi-year customer lifetimes, and payback periods comfortably under 12 months. It was designed for a business with 70 to 80% gross margins. Below 1:1, you’re destroying value with every customer you win. Between 1:1 and 2:1, you probably can’t fund growth from operations. At 3:1, you have a working engine, in SaaS. For a bootstrapped service business running 50 to 60% margins with lumpier revenue, 4:1 is a more honest minimum. You need the cushion because you don’t have a venture firm writing checks while you figure out unit economics.
The payback period matters too, and it’s where small operators often get squeezed. If your LTV is $2,000 but all of it arrives in year three, you may have a cash flow problem even with a healthy ratio. A business with a $600 LTV that pays back in 90 days may be more survivable than one with a $3,000 LTV that takes two years to recoup. Know both numbers, not just the ratio.
One more thing: a ratio above 5:1 is not a gold star. It usually means your acquisition ceiling is higher than you’re using and you’re likely leaving market share on the table. The ratio is most useful when it tells you how much faster you could move, not just how efficient you currently are.
Putting this to work? The ideas in the Canon are the foundation under the tactical playbook in Build a Complete Marketing Departmentgrab the free companion kit at mmsvegas.com/resources.
What Customer Lifetime Value Looks Like in the Real World
The examples that get cited most often are big brands, which is fine for calibration even if the exact numbers don’t apply to a local business.
Starbucks is the canonical case. A margin-adjusted LTV model using 2004 sales data, factoring in customer retention rate and profit margin rather than raw spending alone, put the average customer LTV at approximately $14,099. The revenue-only figure lands closer to $25,272. Either way, the point is the same: Starbucks isn’t selling $5 lattes. It’s acquiring multi-thousand-dollar customer relationships, and the infrastructure it built, one of the earliest mobile loyalty programs in retail, is justified by that math, not by coffee sentiment.
Amazon built Prime on the same logic. Prime members historically spend dramatically more per year than non-members. The annual fee is almost beside the point; it’s the behavioral lock-in and the switching cost that raises LTV on every subsequent transaction.
For small operators, the principle scales down cleanly. A local HVAC company that charges $150 for an annual maintenance contract has customers who might call for a $3,000 system replacement every 10 to 15 years and refer a neighbor on top of that. The maintenance contract looks like a thin-margin product in isolation. Viewed through LTV, it’s the anchor that keeps high-margin replacement revenue in-house instead of letting it walk to a competitor.
A marketing agency with monthly retainer clients might calculate an average LTV of $18,000, $1,500/month × 12 months average retention. At 3:1, they can justify spending $6,000 per won client on acquisition: a salesperson’s time, LinkedIn ads, conference attendance, referral bonuses. Many agency owners would flinch at spending $6,000 to close a single deal. The LTV math says that flinch is costing them growth.
Why Raising LTV Beats Chasing Cheaper Leads
This is where most operators have it backwards. And it’s where the real leverage sits.
When acquisition costs go up, which they do, in every channel, over time, the instinct is to find cheaper leads. Cut the ad budget, try a new platform, negotiate the agency down. That’s playing defense on a cost you don’t fully control. The alternative is to raise your LTV, which puts the problem on a variable you do control.
Consider the actual numbers. You’re spending $300 to acquire a customer with an LTV of $600. Your ratio is 2:1, technically alive, but barely. You could try cutting CAC to $150, which means either accepting worse ad placements or targeting a cheaper (and often lower-quality) audience. Or you could raise LTV from $600 to $900, a 50% lift, by adding a second service tier, extending average retention by one month, or systematizing the upsells you’re already making informally. Now your ratio is 3:1 without touching your acquisition spend. More usefully: your CAC ceiling just went up, which means you can outbid competitors for the same leads and win more of them.
There are three levers on LTV, and none of them are exotic.
1. Retention
This is the biggest one in most businesses. Small improvements compound dramatically. Reducing monthly churn from 5% to 4% increases average customer lifespan by 25%. For a subscription business with $50 monthly revenue per customer and a 70% margin, that single percentage point raises LTV from $700 to $875. No new product, no new marketing, just keeping customers a little longer.
The practical implication here is underappreciated: your onboarding process is an LTV intervention. Customers who reach value quickly stay longer. Those who feel confused or underserved in the first 30 days churn at a disproportionate rate. Most small businesses treat onboarding as an operational task. It’s actually the highest-leverage marketing activity you do, because it multiplies every dollar you spent acquiring the customer in the first place.
2. Purchase Frequency and Average Order Value
Getting customers to buy more often or spend more per transaction raises LTV without changing retention at all. Upsells, cross-sells, membership programs, maintenance contracts, these all live here. A home-services business that adds an annual protection plan converts a transactional relationship into a recurring one and multiplies LTV without acquiring a single new customer.
The mechanism is unglamorous: it’s asking. Most small businesses leave upsell revenue on the table because nobody systematically asks for it. A prompt in your invoice, a follow-up call at the 60-day mark, a loyalty reward that triggers at a spend threshold, none of these require a product team. They require a process.
3. Referral Value
Referred customers carry higher LTVs than cold-acquired ones. Research published in the Journal of Marketing by Schmitt, Skiera, and Van den Bulte (Wharton School) tracked nearly 10,000 customers and found that referred customers generate approximately 16% higher lifetime value than non-referred customers with similar demographics, and their churn rate runs lower as well. They come pre-sold on the relationship, trust the source, and are more likely to stick. If your business earns referrals but doesn’t measure or actively cultivate them, you’re leaving a real multiplier off your LTV calculation. A simple referral program, even just a handwritten thank-you and a modest gesture of appreciation, moves this number.
None of these levers are complicated. The discipline is treating them as LTV levers rather than nice-to-have customer service gestures. The math makes the investment case in a way that “treat customers well” never quite does on its own.
Where LTV Works Best, and Where It Gets Slippery
LTV is most powerful in businesses with repeat purchase potential: service businesses, subscriptions, memberships, consumables, B2B relationships, professional services. Any category where “getting the customer” is really just the first transaction in a longer economic relationship benefits enormously from LTV thinking.
It’s less reliable in a few specific situations:
True one-transaction businesses. A funeral home, a homebuilder, a wedding photographer, if the realistic repeat-purchase probability is near zero, LTV calculation collapses to roughly first-transaction margin. That’s not useless (it still sets a rational acquisition ceiling), but the multi-period math doesn’t give you much additional information. The referral leg of LTV matters more here than anywhere else.
Very early-stage businesses. If you have fewer than 100 customers, your lifespan and churn data are too thin to be reliable. Use industry benchmarks as a proxy, be conservative, and revisit every six months. Treat your early LTV as a hypothesis you’re testing, not a fact you’re citing.
Highly volatile pricing environments. If your average order value or margin swings dramatically, project-based businesses with wide price ranges, commodity-driven businesses, your LTV average may mask a bimodal distribution. The average of a $500 customer and a $10,000 customer is $5,250, which may describe neither of them. Segment before you average.
When you optimize for LTV at the expense of acquiring customers at all. A business that gets so conservative about CAC, because it’s protecting a tidy ratio, that it slows acquisition to a trickle is making a real mistake. The ratio is a health check, not a reason to stop spending on growth.
What People Get Wrong About Customer Lifetime Value
These are the conceptual errors, the wrong mental models that lead operators to calculate LTV incorrectly or draw bad conclusions from it. The operational mistakes (how they show up in practice) are covered separately in the Common Mistakes section below.
“LTV is revenue, not profit.” A lot of operators calculate LTV as total revenue per customer and then compare it to a CAC that includes real costs. That’s an apples-to-oranges comparison that overstates your efficiency. LTV should always be built on gross margin, what you actually keep after direct costs of delivering the product or service. If your gross margin is 40%, a customer who pays you $5,000 over their lifetime has an LTV of $2,000, not $5,000.
“A higher LTV:CAC ratio is always better.” This one trips up bootstrapped operators who’ve been frugal on acquisition. A 10:1 ratio sounds excellent, but it often means you’re dramatically underinvesting in growth, the economics support spending much more to acquire customers, and you’re leaving market share on the table. Above 5:1 is a signal to look harder at acquisition channels, not to congratulate yourself.
“LTV is a fixed number.” It isn’t. It’s a snapshot of your current unit economics that changes as you improve retention, add products, or change pricing. Some operators calculate it once and treat it as gospel. Revisit it at least annually, more often if you’re actively running experiments on retention or upsell.
“LTV makes it okay to lose money on every customer.” Only if the payback period is survivable and your capital position can sustain the gap. Venture-backed startups can run negative-margin acquisition for years because someone else is funding the float. A small business without that runway can have a theoretically excellent LTV:CAC ratio and still run out of cash waiting to collect it. Time-to-payback is as important as the ratio itself.
“Predicted LTV is reliable.” Predictive LTV, modeling what future customers will be worth based on early signals, is genuinely useful for large-scale e-commerce and SaaS, where you have cohort data and statistical mass. For most small businesses, historical LTV (what your actual past customers spent) is far more trustworthy. Build your acquisition decisions on historical data and treat any forward projection as a directional estimate, not a fact.
Common Mistakes
- Calculating LTV on revenue instead of gross marginA landscaping company once quoted us a $4,200 LTV per customer, impressive until we subtracted labor, fuel, and materials and landed at $1,900. They’d been using that inflated number to justify an acquisition budget they couldn’t actually afford. Always subtract direct costs of delivery before you multiply. LTV is what you keep, not what you bill. Revenue-based LTV can overstate the real number enough to put your acquisition spend seriously underwater.
- Using a single blended LTV average across wildly different customer segmentsA regional pest control company ran one LTV calculation across all accounts and got a number in the mid-$800s. Looked fine. When they segmented residential from commercial, the residential LTV was $480 and commercial was $2,400. They’d been allocating sales effort equally between the two. Once they saw the numbers separately, they redirected most of their outbound effort to commercial property managers and grew that segment 40% in a year. Segment by customer type, contract size, or acquisition channel before you average, a $500 customer and a $10,000 customer average to $5,250, which describes neither of them.
- Loading only ad spend into CAC and ignoring salaries, tools, and agency feesThe most common version of this: a founder counts the $2,000/month in Facebook spend but not the $4,000/month in agency fees or the 15 hours per week they personally spend on sales calls. Their ‘CAC’ looks like $180. Their real CAC, loaded fully, is closer to $420. That’s the difference between a healthy ratio and a cash flow problem. Include everything, ad spend, agency fees, your own time at a reasonable hourly rate, CRM and marketing tool subscriptions, and any commission or referral payouts. Underloading CAC makes the ratio look healthy when it isn’t.
- Treating a high LTV:CAC ratio as a sign of discipline rather than a signal to invest moreA SaaS consultancy was running a 9:1 ratio and celebrating it in investor updates. What they didn’t see: a direct competitor was running at 3.5:1 and spending three times as much on acquisition in the same market. Two years later, the competitor had acquired most of the available accounts. A high ratio isn’t inherently bad, but above 5:1, the honest question is whether you’re being disciplined or just timid. If the economics support more aggressive acquisition and you’re not taking it, someone else will.
- Ignoring payback period and only watching the ratioA marketing agency had a genuine 4:1 LTV:CAC ratio, the math looked great. But 80% of their retainer value arrived in months 7 to 18 of the customer relationship, and their average client took three months to onboard before billing even started. They were growing fast enough that new client acquisition costs were going out the door consistently while the back-end revenue lagged behind by six months. They ran out of operating cash during what was technically their best growth quarter. Track both the ratio and the time-to-recover your acquisition cost. A great ratio that pays back in 30 months can still kill a bootstrapped business.
Operator’s Take
Most operators nod at LTV and almost nobody uses it well. Not because the math is hard, it isn’t, but because actually doing the calculation forces decisions people have been avoiding. Here’s what I’d actually do with this metric, in order.
Step one: run the napkin math this week, not someday. Pick your most common customer type. Open a spreadsheet or grab a pen. Write down average order value, rough purchase frequency, your honest gross margin percentage, and how long a typical customer actually stays, not how long you hope they stay. Multiply it out. You’ll have a working LTV number in ten minutes. Then calculate your real CAC: take last quarter’s total sales and marketing spend, ad budget, agency fees, your own hours at a fair rate, tools, and divide by new customers won. That ratio tells you immediately whether you have room to grow faster or a unit economics problem to fix first.
Step two: set an actual acquisition ceiling and use it. Take your LTV, divide by 3 (or 4, if you’re bootstrapped with thin margins). That’s the most you should spend per acquired customer to run a healthy engine. Now look at every channel you’re running, Google Ads, referrals, trade shows, whatever, and compare what each channel actually costs per won customer against that ceiling. Channels running well under the ceiling deserve more budget. Channels running over it need to be fixed or cut. That single exercise replaces most of the hand-wringing that passes for marketing strategy in small businesses.
Step three: pick one LTV lever and move it before you touch acquisition. Don’t try to improve retention, upsells, and referrals simultaneously. Pick the one that’s most obviously broken. If you have no systematic 60-day check-in call, build that first, it’s the single cheapest retention intervention most service businesses can run, and one extra month of average lifespan often beats a 15% bump in average order value on the LTV math. If your customers never hear from you after purchase, fix onboarding. If nobody’s asking for referrals, set up a dead-simple ask, an email at the 90-day mark, a referral card in your invoice, anything systematic. One lever, moved consistently, beats three levers moved occasionally.
Step four: revisit the number every six months. LTV isn’t a one-time calculation. As you add products, change pricing, or shift your customer mix, the number shifts too. Put a recurring calendar event on your books. Pull the cohort data, recalculate, and compare to your prior number. If it’s going up, your retention and expansion work is landing. If it’s going down, something changed, pricing, product quality, competitive pressure, customer mix, and you need to know which one before you scale acquisition spend.
Here’s where I’d push back on the whole concept: LTV can become a comfort blanket. I’ve seen operators calculate it, convince themselves the unit economics look fine, and use that as cover for not fixing a product or service that customers are quietly leaving. The math only holds if the behavior underneath it holds. Calculate it honestly, test your assumptions against real cohort data, and revise when reality disagrees with your model.
On the AI side: tools can now pull your customer data, build cohort analyses, and flag retention trends faster than any manual process. That cuts your dependence on an analyst or consultant to surface what’s happening with your customer base, useful for operators who’ve skipped this work because it felt too labor-intensive. The judgment calls still sit with you. Which lever to pull first, how aggressive to get on acquisition given your cash position, whether a retention dip is a data blip or a product problem, those aren’t decisions a tool makes. It surfaces the information. You make the call.
Used in
- ✓ Build a Complete Marketing Department
Used to set the acquisition budget ceiling for every channel, LTV is the number that converts a marketing spend from an expense into a calculated investment with a known return target. - ✓ The Missing Manual for FunnelKit
Used to design funnel economics, specifically to determine how much margin is available for a front-end offer or loss-leader, and to size the backend sequences that recover and build LTV post-purchase. - ✓ The Missing Manual for Make
Used to automate LTV-driving workflows, retention check-ins, upsell triggers, referral requests, and churn-risk alerts that systematically act on LTV levers without requiring manual follow-up.
FAQ
What’s the simplest way to calculate customer lifetime value for a small business?
Multiply your average order value by how many times a customer buys per year, then by your gross margin percentage, then by the average number of years a customer stays with you. That gives you a working LTV number in under ten minutes. It won’t be perfect, but it will be far more useful than no number at all.
What’s a healthy LTV:CAC ratio?
The broadly cited benchmark is 3:1, you earn $3 in lifetime gross profit for every $1 spent acquiring a customer. That benchmark was popularized by venture capitalist David Skok of Matrix Partners around 2010 and was drawn from mature public SaaS companies with 70 to 80% gross margins. Bootstrapped service businesses should target closer to 4:1 to account for thinner margins and less financial cushion. Above 5:1 often signals you’re underinvesting in acquisition; below 2:1 means your unit economics need work before you scale.
My business is new and I don’t have retention data. How do I estimate LTV?
Use industry benchmarks as a proxy and be conservative. If you know your monthly churn rate, divide 1 by that rate to estimate average customer lifespan in months. Revisit the number every six months as you accumulate real data, treat it as a hypothesis you’re testing, not a fact.
Is it better to try to raise LTV or lower my customer acquisition cost?
Almost always raise LTV. CAC is largely set by competition in your market, you can optimize it, but you can’t control it. LTV is driven by your product, your retention, and your backend offers, things you own. A higher LTV raises the ceiling on what you can spend to acquire customers, which means you can outbid competitors without changing your ads at all.
Should I include referral revenue in my LTV calculation?
Yes, if your business earns meaningful referrals. Estimate how many new customers the average existing customer refers over their lifetime, then add that fraction of a new customer’s LTV to your calculation. Businesses that ignore referral value significantly underestimate LTV and underinvest in the retention and satisfaction activities that generate those referrals.
Can LTV justify losing money on the first sale?
In theory, yes, and it’s a common strategy in direct response marketing. In practice, it depends entirely on your payback period and capital position. A bootstrapped business that loses money on acquisition and waits 18 months to recoup it can face serious cash flow problems even with a strong LTV. Know your payback period, not just your ratio, before you run a loss-leader acquisition strategy.
Further reading
- Getting Everything You Can Out of All You’ve GotJay Abraham. The direct response text that made lifetime value thinking practical for small-business operators, specifically Abraham’s concept of ‘marginal net worth’ per customer, which reframes acquisition budgets as investments against long-run customer value.
- Magnetic MarketingDan Kennedy. Kennedy’s system for customer acquisition is built on LTV as a core premise; the book explains how to set acquisition budgets rationally rather than emotionally.
- Database Marketing: Strategy and ImplementationRobert Shaw and Merlin Stone (1988). One of the first books to put the term ‘customer lifetime value’ in print with detailed worked examples; valuable for context on where the concept originated, though the tactical content is dated.
- SaaS Metrics 2.0David Skok, For Entrepreneurs (forEntrepreneurs.com). The post that popularized the 3:1 LTV:CAC benchmark; essential reading if you want to understand what the ratio was actually designed to measure, and where it stops applying.
Sources: Wikipedia, ‘Customer Lifetime Value’; MediaPost, ‘Database Pioneer Kate Kestnbaum Dies at 87’; Salesforce AU/IN, ‘The Complete History of CRM’; Winners FDD, ‘History of CRM’; Vivian Voss / Dynamics 365, ‘History of Customer Relationship Management’; David Skok / Matrix Partners, ‘SaaS Metrics 2.0’, for the 3:1 LTV to CAC floor and its origin as a mature-SaaS heuristic rather than a universal rule. Schmitt, Skiera & Van den Bulte (2011), ‘Referral Programs and Customer Value,’ Journal of Marketing, Vol. 75, pp. 46 to 59; Blattberg, Malthouse & Neslin (2009), ‘Customer Lifetime Value: Empirical Generalizations,’ Journal of Interactive Marketing.
Brian Kasday spent forty years in direct-response marketing before rebuilding the whole operation as a one-person shop. He writes The Operator’s Library, including “Build a Complete Marketing Department”, for operators who’d rather build it themselves than wait on someone else.
Build the department these ideas describethe free companion kit: mmsvegas.com/resources.
More The Operator's Canon guides
Free · Operator Toolkit
Want the tools, not just the guide?
Get the free operator toolkit — templates and checklists for the systems you actually run, plus a note when this guide changes.
Get the free toolkit →How to cite: Customer Lifetime Value (LTV / CLV). Associated with Robert & Kate Kestnbaum, 1988. The Operator’s Canon, MMS Vegas. https://mmsvegas.com/library/customer-lifetime-value-explained/