
Last updated: July 2026
The Ansoff Matrix is probably the most underused growth-planning tool a small-business operator has access to, and almost certainly the simplest. By the end of this page, you’ll be able to sit down with a napkin and a pen, map every growth option in front of you, rank them honestly by risk, and make a defensible call about where to put your next dollar.
Here’s the situation it was built for. You’re running a business that works. Maybe revenue is flat, maybe you’ve hit a ceiling in your current customer base, maybe a competitor just walked into your market. Someone in the room says, “We need to grow.” That’s not a strategy, that’s a wish. And the next hour is usually spent arguing about the same three ideas with no shared language for comparing their risk profiles.
The Ansoff Matrix gives you that shared language. It forces a choice between four fundamentally different growth directions, each carrying a distinct level of risk, and it makes explicit what you’re actually betting on when you pick one. That’s it. No MBA required. But used properly, it can stop you from making the most expensive mistake in small-business growth: chasing novelty when the real money is sitting in the room you already own.
The idea in 30 seconds
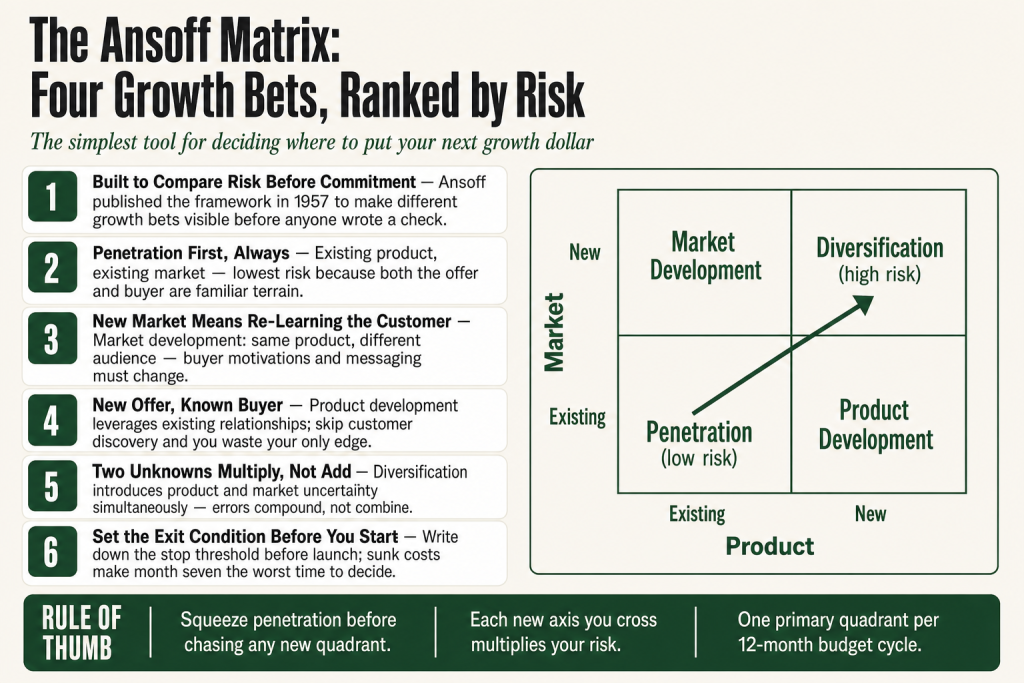
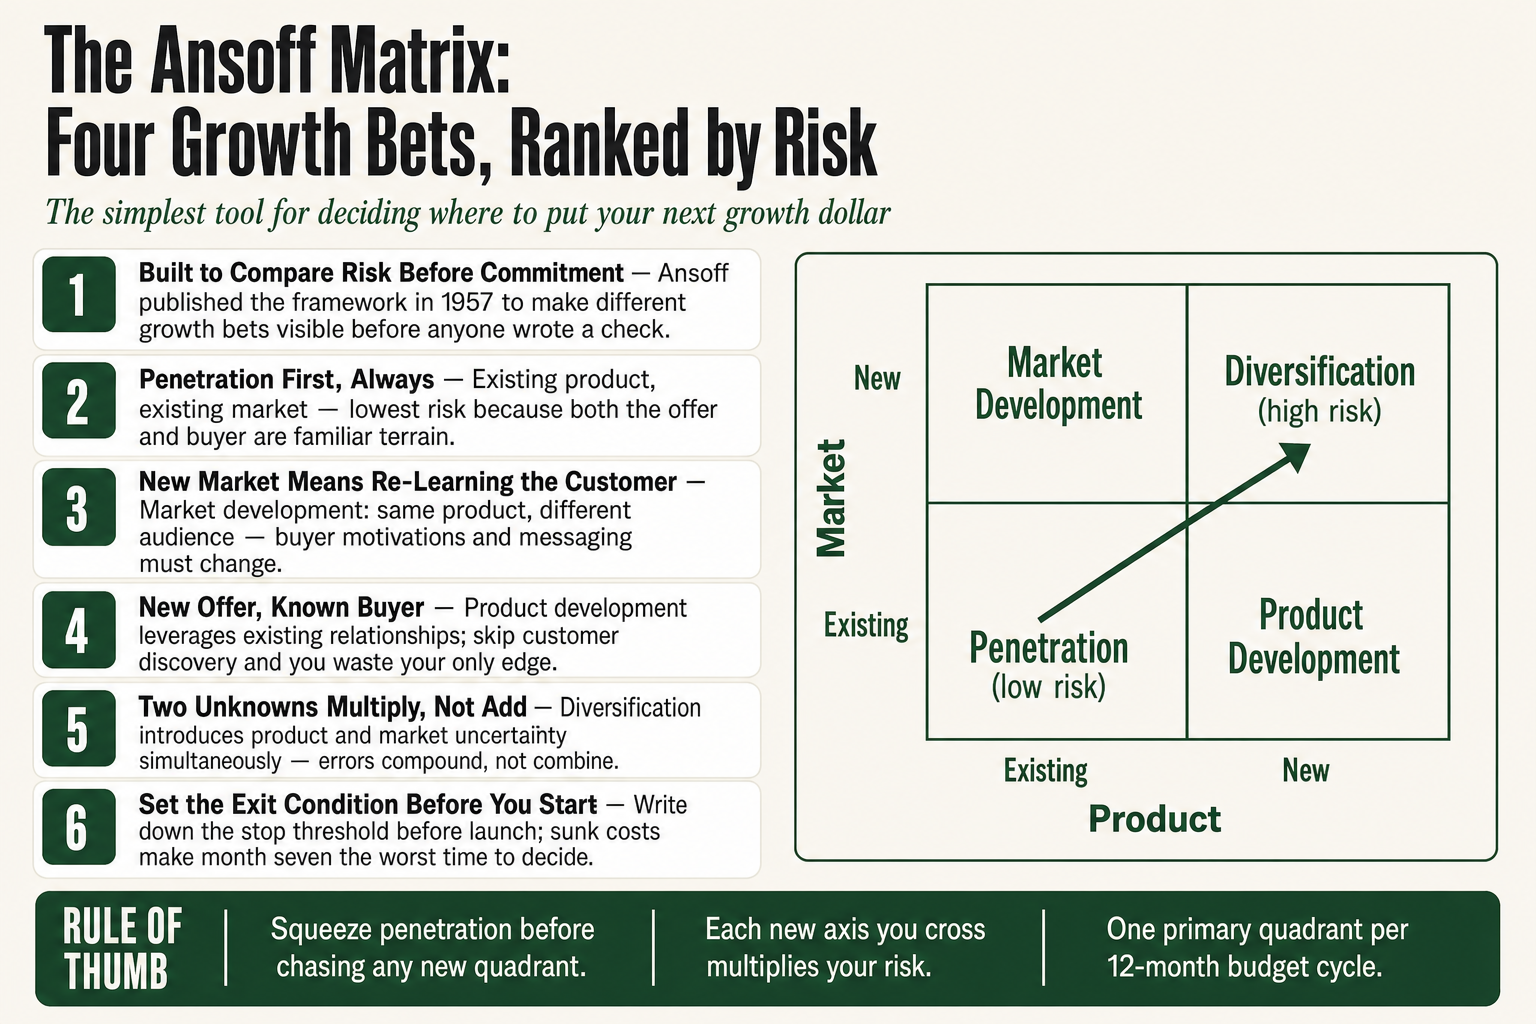
- The Ansoff Matrix is a 2×2 grid that maps four growth strategies, market penetration, market development, product development, and diversification, against two variables: how new the product is and how new the market is.
- Risk increases with every step away from what you already know: penetration is cheapest and most predictable; diversification is the most likely to destroy cash.
- Most small operators should default to market penetration first, squeeze more from existing customers before chasing new ones.
- The matrix doesn’t tell you how to execute; it tells you which direction to bet on, and forces you to be honest about which quadrant you’re actually in.
- Common mistake: calling a price cut “strategy”, penetration requires real competitive advantage, not just discounting.
- Use it annually as a sanity check before committing budget, not as a one-time exercise.
Where the Ansoff Matrix Came From
Igor Ansoff was a Russian-American applied mathematician who spent most of the 1950s doing strategic work at the RAND Corporation, advising on technology and weapons-systems acquisition for the U.S. Air Force. In 1957 he left RAND to join the Corporate Planning Department of Lockheed Aircraft Corporation, the same year he published his framework in the Harvard Business Review in an article titled “Strategies for Diversification.” He later expanded it into his 1965 book Corporate Strategy.
The problem he was solving was specific: large enterprises kept conflating very different kinds of growth bets, selling more of an existing product into existing markets versus launching an entirely new product category into a market the company had never touched. Those decisions carry wildly different risk profiles and require completely different capabilities. He wanted a tool that made that difference visible before anyone wrote a check. The 2×2 grid he landed on plotted two questions, how new is the product, and how new is the market, and the four combinations named themselves.
For operators today, the origin story matters for one reason: the tool was built to compare risk before commitment. That use case is as relevant now as it was at Lockheed in 1957.
The Ansoff Matrix: All Four Quadrants, Plain Language
The grid has two axes. Horizontal: existing product versus new product. Vertical: existing market versus new market. That gives you four cells. Each one is a growth strategy with its own risk level, cost profile, and failure mode. They don’t operate in isolation, each connects to specific execution tools. Market penetration calls for the 4 Ps of Marketing to optimize price, place, and promotion without reinventing anything. Product development demands customer discovery before you build. Market development requires you to rebuild your value proposition for an audience that doesn’t know you yet. Understanding which quadrant you’re in tells you which companion tools to reach for first.
Quadrant 1, Market Penetration (Existing Product, Existing Market)
This is the quadrant where most operators should spend most of their time. You’re selling more of what you already sell to people who already look like your current customers. Lower risk because both the offer and the buyer are familiar terrain.
In practice this means: better conversion on existing traffic, tighter retention, loyalty mechanics, more aggressive outreach to lapsed customers, price optimization, tighter distribution. Analysts applying the matrix to Coca-Cola’s corporate strategy consistently identify market penetration as the company’s primary intensive growth strategy, wider distribution, bigger marketing spend, and promotional tactics across markets where Coca-Cola already operates, rather than any meaningful change to the core product or the customer base. They don’t need to learn anything new about the buyer. They just need to show up more effectively.
For a local operator, penetration looks like: a follow-up sequence that actually runs, a referral program with teeth, a seasonal offer engineered to bring back people who bought once and went quiet. You’re not inventing anything. You’re executing better on what already works.
The ceiling on penetration is real, at some point, market share is as high as it goes and the remaining customers are the ones who genuinely don’t want you. But most operators hit that ceiling far less often than they think. They exit penetration too early because new things feel more exciting than squeezing the last 20% out of what’s working.
Quadrant 2, Market Development (Existing Product, New Market)
You take what you already sell and find a different audience for it. That audience might be geographic, a neighboring city, a new country, or it might be a different segment that wasn’t in your original customer profile. Your product doesn’t change. Your positioning, messaging, and sometimes your channel do.
Netflix’s international expansion is a widely cited example of market development in the Ansoff framework. Netflix began its international rollout in 2010 with Canada, expanded into Latin America and the Caribbean in 2011, and entered Europe in 2012, keeping the core streaming model intact while adapting content libraries for each new market. Same product architecture; new markets to learn. Starbucks entering Japan, Germany, or South Korea follows the same logic at a brand level: same coffee, same store format, different market.
For a small operator this might be: a B2B service originally sold to law firms now being pitched to accounting firms. A home-services business that has saturated its home ZIP codes now expanding a territory. A niche e-commerce shop finding that a demographic segment it never targeted is quietly buying anyway, and then deciding to go get more of them intentionally.
The risk here is underestimating how different the new market actually is. Buyer motivations, vocabulary, competitive set, and decision-making process can all shift substantially even when the product doesn’t move an inch. The operators who get this wrong assume that because the product didn’t change, the marketing doesn’t need to either. This is exactly where rebuilding your Value Proposition Canvas for the new audience pays off, it forces you to pressure-test that assumption before you spend anything.
Quadrant 3, Product Development (New Product, Existing Market)
You already have the customer relationship. Now you’re developing something new to sell them. Apple is the textbook case: existing iPhone buyers get Apple Watch, iPad, AirPods. The audience doesn’t change; the offer expands. This is why Apple’s revenue per customer has compounded so aggressively over two decades, they understood product development as a customer-retention and share-of-wallet play, not a pure acquisition play.
For operators, this quadrant shows up as: adding a service tier your current clients keep asking for, building a product adjacent to your core, or launching a subscription where there was only a transactional relationship before. A marketing agency adding fractional-CMO retainers to a project-based client roster. A fitness studio adding an online membership to serve people who’ve moved away but miss the programming. A CPA firm adding bookkeeping software to a tax-only client base.
The failure mode here is building what you think customers want instead of what they actually pull toward. Product development in Ansoff’s framing is still grounded in a known market, the insight advantage you have is your existing customer relationships, and if you’re not mining that intelligence before you build, you’re wasting your only edge. This is exactly where a minimum viable product approach pays off, test the new offer with existing customers before you build the whole thing. And before you even get to an MVP, actual customer discovery interviews with your best current clients are what tell you whether you’re solving a real problem or a hypothetical one.
Quadrant 4, Diversification (New Product, New Market)
Two unknowns simultaneously: a product you haven’t built for a market you don’t know. This is the highest-risk quadrant, and the gap between large-company diversification and small-operator diversification is enormous. Amazon moving from books into cloud computing with AWS is a celebrated case of related diversification, the infrastructure Amazon had built to run its own retail operations turned out to be something enterprises would pay for. AWS launched in 2006 and generated roughly $107 billion in revenue in 2024. It worked spectacularly. But Amazon had billions in capital, a world-class engineering organization, and years of runway to absorb losses. Most operators have none of those things.
There are two flavors of diversification: related (the new product or market shares something with your current business, technology, supplier relationships, distribution) and unrelated (genuinely separate ventures). Related diversification occasionally makes sense for operators. Unrelated diversification, the restaurant owner who buys a laundromat “to diversify”, is almost always a distraction wearing a strategic costume.
The honest take: treat Quadrant 4 with skepticism unless your core business is genuinely throwing off so much cash that you have no higher-return use for it in the other three quadrants. That situation is rarer than the entrepreneurs you meet at networking events would have you believe.
How the Risk Logic Actually Works, and Why It Matters
The rule Ansoff built into the grid is elegant: every time you move into a new quadrant, horizontally (new product) or vertically (new market), risk increases. Move in both directions at once, and you’re in the most dangerous cell. The logic is simply about what you know going in.
When you’re in penetration, you understand the customer’s problem, your product’s fit, your competitive context, and your acquisition channels. Nothing is a full unknown. Execution risk is real, you still have to do the work, but information risk is low. You’re not learning the market; you’re competing in it. This is also the quadrant where confirming product-market fit matters most: if you can’t articulate why your current customers stay and buy again, the risk logic of every other quadrant becomes meaningless, because you’re building on an unstable foundation.
Move to market development and you introduce market uncertainty. Your product knowledge is solid; your knowledge of the new audience is incomplete. You’ll need to re-learn messaging, channel, sometimes pricing. You might discover that what made you the obvious choice in your home market doesn’t translate, either because competitors there are stronger or because buyer motivations are genuinely different.
Move to product development and you introduce product uncertainty. You know the buyer; you don’t yet know if the new offer will resonate, whether the margin will hold, or whether you’ve actually understood the problem you’re solving. This is why direct customer input, actual customer discoveryis so important before committing to new product development. Assumptions are expensive.
Diversification introduces both. There’s a reason the literature consistently calls it the riskiest quadrant: two unknowns don’t add their risks, they multiply them. Errors compound. You can’t fall back on prior customer knowledge to debug why the product isn’t selling, because you don’t really know the customer. You can’t fall back on prior product knowledge to recalibrate positioning, because you haven’t shipped this product before.
For operators who think in terms of CAC and LTV, the matrix is really a way of estimating the uncertainty range around your acquisition and retention assumptions before you’ve made the bet. Penetration has tight ranges, you’ve seen this before. Diversification has enormous ranges. That spread matters when you’re the one funding the experiment.
Putting this to work? The ideas in the Canon are the foundation under the tactical playbook in Build a Complete Marketing Department — grab the free companion kit at mmsvegas.com/resources.
How to Apply the Ansoff Matrix as a Small-Business Operator
The way most people use this tool is wrong. They draw the grid, label the quadrants, and then start filling in ideas from a brainstorm. That produces a list of things you could do, not a framework for deciding what to do next. Here’s a sharper process.
Step 1: Be brutally honest about where you are in Quadrant 1
Before you consider any other quadrant, ask: have you genuinely exhausted market penetration? Specifically, what is your current customer retention rate? What percentage of customers have bought more than once? What’s your referral rate? What does your reactivation sequence look like for lapsed buyers?
Most operators who are convinced they’ve maxed out penetration haven’t. They’ve hit a plateau in one acquisition channel and interpreted that as a market ceiling. Those are different things. Run the actual numbers. If your 12-month retention rate is under 50% and you have no active reactivation program, you have not maxed out penetration. You’ve under-executed it.
Step 2: Inventory your actual competitive advantages before moving quadrants
Moving to market development or product development only makes sense if the thing that makes you good in your current market travels with you. What do you actually have?
- Relationships with existing customers, these travel into product development; they don’t help much in market development.
- Brand reputation or positioning in a specific geography or niche, these travel into adjacent markets that share the same awareness; they don’t help in unrelated new markets.
- Operational or technical capabilitya team that can build something new, or serve a new customer type. This is the most transferable asset for product development.
- Distribution or channel accessexisting shelf space, existing email list, existing referral network. These travel well in penetration and modestly in product development.
If none of your advantages travel into the quadrant you’re considering, you should reconsider. You’re not entering a new quadrant with a head start; you’re starting from zero with a smaller runway than a dedicated competitor who’s been there for years.
Step 3: Map the risks, not just the opportunities
For each quadrant you’re considering, write down the three things most likely to go wrong, not generically (“market might not respond”), but specifically (“our messaging has only been tested on construction-sector buyers; healthcare procurement works completely differently and we have no relationships there”). Concrete failure modes are more useful than abstract risk ratings.
The matrix is a good forcing function here. It makes you name what you don’t know. That naming is the whole point, most expensive growth mistakes begin with an operator who was in too much of a hurry to answer “what do we not know about this?”
Step 4: Sequence, don’t pursue in parallel
One of the real pitfalls operators fall into is running penetration, market development, and product development simultaneously, convincing themselves they’re being agile. Usually they’re just being under-resourced in three places at once. The matrix works best as a sequencing tool: nail penetration first, then earn the right to market development, then earn the right to product development. Layer diversification in only when the other three are generating surplus cash and management attention.
This isn’t dogma, sometimes market development is the right first move if your existing market is genuinely tiny and structurally limited. But the sequencing discipline forces you to ask “have we squeezed this quadrant first?” before you authorize the more expensive experiment. That’s a useful friction to build into your planning process.
Where the Ansoff Matrix Still Works Well
Annual strategic reviews. The matrix does its best work when you bring it out once a year, before budget planning, and force the ownership or leadership team to agree on which quadrant is the primary growth bet for the next 12 months. Not a laundry list, one primary quadrant. That single constraint produces better budget decisions, more focused marketing plans, and clearer accountability than any multi-initiative roadmap.
Service businesses, in particular, get a lot from this framework. The temptation in a service business is constant scope creep in the direction of product development, new service lines added because a client asked, or because a competitor launched something, rather than because it fits a deliberate strategy. The matrix creates a pressure-test: is this new service truly a product development move for our existing market, or are we just saying yes to things?
It’s also valuable at the moment of a revenue plateau. When growth stalls, operators tend to jump immediately to the question of “what new thing should we offer?”, that’s product development or diversification thinking, and it may not be the right answer. The matrix forces the question: are we actually sure penetration is exhausted? Usually the honest answer reveals gaps in retention, follow-up, or referral mechanics that were being ignored.
Finally, it works well as a communication tool with teams, advisors, or investors. Saying “we’re in a market penetration phase” communicates a clear set of priorities, more conversion optimization, better client experience, more active referral generation, and just as clearly communicates what you’re not doing right now. That clarity has real operational value.
Where the Ansoff Matrix Falls Short
The honest critique is that the Ansoff Matrix is a sorting tool, not an execution tool. It tells you which kind of bet you’re making; it tells you almost nothing about how to win that bet. A business in the market penetration quadrant still needs a positioning strategy, a pricing strategy, a channel strategy, a retention system. The matrix names the direction but doesn’t build the road.
The two-variable simplification can also mislead. Real businesses have multiple product lines, multiple customer segments, and fuzzy market boundaries. A regional accounting firm might be in penetration for its tax-prep clients, market development for its new payroll offering aimed at a slightly different business size, and product development for a software tool it’s building for existing audit clients, all simultaneously. The matrix handles this by insisting you pick a primary bet, which is useful discipline, but it doesn’t model portfolio complexity well.
It’s also internally focused. The matrix asks “how new is the product?” and “how new is the market?”, but it doesn’t ask “what are competitors doing?” or “what’s happening to customer behavior externally?” A market penetration strategy that made perfect sense in a stable market might be suicide in a market where a new entrant just commoditized your core offer. The matrix needs external context that it doesn’t supply on its own.
And the risk calibration is relative, not absolute. “Penetration is lower risk than diversification” is reliably true as a comparison. But penetration in a structurally declining market is still high risk in absolute terms. The matrix doesn’t flag declining markets, shifting customer preferences, or technology disruptions. You have to bring that intelligence to the framework yourself.
None of this invalidates the tool. It means you should use it as one input in your strategic process, a fast, honest sorting of your options, and then reach for other frameworks to build the execution plan. Richard Rumelt’s Strategy Kernel is a useful complement: once the Ansoff Matrix tells you which direction you’re betting on, the kernel forces you to diagnose the real obstacle and build a coherent approach to removing it. And once you’ve chosen a direction, the 4 Ps of Marketing translate that quadrant choice into concrete decisions about product, price, place, and promotion, because the Ansoff Matrix names the bet, but the 4 Ps are how you actually place it.
Common Misunderstandings About the Ansoff Matrix
“Market penetration just means cutting prices.” No. Price cuts can be a tactic within a penetration strategy, but they’re not the strategy itself, and often they’re the worst execution of it. Real penetration is about winning more share against your current competitors in your current market through superior positioning, better conversion, stronger retention, and more effective channel coverage. A price cut that doesn’t come with a defensible cost advantage is just margin compression with extra steps.
“The four quadrants are stages, you go through them in order.” They’re not stages; they’re options. The right quadrant depends on your situation: your current market’s size, saturation, and growth trajectory; your competitive advantages and which ones travel; and your available capital and management bandwidth. Some businesses legitimately start in product development or market development because their home market is too small to build a real company. Sequencing penetration-first is good default advice; it’s not a universal law.
“Diversification is always the wrong move.” Diversification is the riskiest quadrant, that’s not the same as wrong. Related diversification at the right moment, with the right capital base, is how a lot of durable businesses were built. The trap isn’t diversification per se; it’s entering Quadrant 4 when you haven’t yet optimized the other three, or when the new venture shares nothing with your existing capabilities except the owner’s optimism.
“The matrix tells me what to do.” The matrix tells you what kind of thing you’re doing. It’s a classification and risk-comparison tool, not a strategy generator. You still have to do the hard work of understanding your customer, your competitive position, and your execution capacity. The matrix organizes that work; it doesn’t replace it.
“Market development and product development have similar risk levels.” They don’t, and the direction matters a lot for operators. Market development asks you to re-learn a customer. Product development asks you to re-learn an offer. For most service businesses, re-learning a customer is harder and slower than building a new service line for people you already understand. That asymmetry is worth knowing before you choose a direction.
Common Mistakes
- Reusing existing marketing copy when entering a new market segment — Operators assume that because the product didn’t change, the pitch doesn’t need to either. It does. Run five to ten short interviews with people in the target segment before spending anything on acquisition, ask what they call their problem, who they currently use, and what would make them switch. What you hear will be different enough to rewrite your messaging from scratch.
- Launching a new service without checking whether current clients would actually buy it — The typical failure here is building based on one enthusiastic client conversation, then discovering that client was the exception. Before any development work, pitch the concept to ten of your best customers at the actual price point and ask if they’d be a beta customer in the next 90 days. Not ‘would you be interested’, that gets polite yeses. Price and timeline get real answers.
- Misreading a one-channel plateau as a market ceiling — When referrals slow down or a single ad channel stops performing, it’s easy to conclude that penetration is maxed out and move on to product development or a new market. Usually it isn’t, pull 12-month retention and repeat-purchase data before drawing that conclusion. A retention rate under 50% with no active reactivation program is not a saturated market. It’s under-executed penetration.
- Funding two quadrants simultaneously on a lean budget — Running a new market development push while also launching a new service line sounds like diversified bets. In practice, on a team of under ten people, it means both initiatives are under-resourced and neither gets a fair test. Pick one primary quadrant per 12-month cycle, fund it to the level it needs, and measure it against a pre-set threshold before opening a second front.
- Skipping the exit condition — Operators set entry criteria, market size, opportunity, competitive gap, but almost never set a pre-committed exit condition before launching a new quadrant bet. Six months in, with sunk costs and team momentum, is the worst time to ask ‘should we still be doing this?’ Write the condition down before you start: if we haven’t hit X by Y date, we stop and return to Quadrant 1. Then hold to it.
Operator’s Take
Here’s what I’d actually say to an operator sitting across from me with an Ansoff grid on the table: the matrix almost never lies, but the conversation around it almost always does.
What usually happens, draw the 2×2, spend twenty minutes placing ideas in boxes, everyone leaves feeling like they’ve done strategy. They haven’t. They’ve done taxonomy. The actual question, which of these bets can we win, and what would have to be true to win itnever gets asked. AI can speed up the brainstorm phase, help you research a new market segment faster, or surface retention data you’d otherwise have to dig for manually. But it can’t answer that question for you. The judgment call stays yours.
The quadrant I’d push operators to be most honest about is penetration. Not because it’s always right, but because the most common version of a bad growth plan is a product development or market development move that was really just an escape from doing the harder work in Quadrant 1. Launching a new service line is exciting. Running a reactivation sequence to 200 people who bought from you once and went quiet is not. But the second one is almost always higher-ROI, and almost everyone procrastinates it.
There’s a version of the matrix conversation I see in service businesses that gets under my skin. The owner can’t quite define what market they’re already in, the customer profile is fuzzy, the value proposition shifts depending on who’s asking, the “existing market” cell of the grid is basically empty because they’ve never been disciplined about it. And then they want to talk about market development. You can’t develop a market you haven’t owned. The matrix will happily let you skip that question if you let it.
One thing the standard explainers miss: the matrix is an unusually good tool for stress-testing a decision you’ve already made but not yet funded. Most operators come to their annual planning having informally settled on a direction, they just haven’t named the quadrant or written down what they don’t know about it. Forcing that naming, before the budget gets approved and before the hire gets made, is where the real value sits.
Which brings me to the thing people skip almost every time: the exit condition. Set it before you start, not after you’ve sunk six months into something that isn’t working. Write it down: if we haven’t hit X by Y date, we stop and return to Quadrant 1. The matrix is a natural prompt for that conversation. Use it for that, because at month seven, with sunk costs and team momentum, is the worst possible time to ask whether you should still be doing this.
Used in
- ✓ Build a Complete Marketing Department
Used during annual growth planning to align marketing budget and channel priorities with the operator’s chosen Ansoff quadrant before any campaign work begins. - ✓ The Missing Manual for FunnelKit
Informs funnel architecture decisions, a penetration play calls for conversion optimization funnels; a product development play requires a new-offer launch sequence targeting existing contacts. - ✓ The Missing Manual for Make
Referenced when designing automation workflows, the chosen growth quadrant determines whether automations should prioritize retention and upsell (penetration) or new-lead nurture (market development).
FAQ
What is the Ansoff Matrix in simple terms?
It’s a 2×2 grid that maps four growth strategies, sell more of the same to the same people, take the same offer to new people, build new offers for existing customers, or do both at once, ranked from lowest to highest risk. It helps operators decide which growth direction to bet on before committing budget.
Which Ansoff quadrant is right for a small business?
Market penetration is the right default starting point for most small businesses. It carries the lowest risk because you’re operating on known terrain, familiar product, familiar customer. Move to other quadrants only after penetration is genuinely squeezed, or when your market is structurally too small to support the business you want.
What’s the difference between market development and product development in the Ansoff Matrix?
Market development takes an existing product or service to a new audience, different geography, different segment, different channel. Product development builds something new for an audience you already serve. Both carry more risk than penetration, but in different directions: market development means re-learning the customer; product development means re-learning the offer.
Is diversification ever a good strategy for small businesses?
Rarely, and only when the core business is generating strong, stable cash flow and the new venture shares real capability overlap with what you already do. Unrelated diversification, moving into a completely different industry, is almost always the wrong move for resource-constrained operators. The label ‘diversification’ doesn’t make it strategic.
What are the main limitations of the Ansoff Matrix?
It’s internally focused, it doesn’t account for competitor moves, market trajectory, or external disruption. It also simplifies complex situations into a 2×2 grid and provides no guidance on execution. Use it to classify your growth direction and compare risk levels, then use other tools to build the actual plan.
How often should an operator use the Ansoff Matrix?
At minimum, annually, specifically before budget planning season, when you’re deciding where to direct growth investment for the next 12 months. The matrix is most valuable as a recurring check, not a one-time exercise, because your situation and your market change.
Further reading
- “Strategies for Diversification”, H. Igor Ansoff, Harvard Business ReviewVol. 35, No. 5, September, October 1957, pp. 113 to 124. The original article. Denser than you’d expect from a 1957 HBR piece, but worth reading for the underlying logic Ansoff was trying to solve, which is more nuanced than the 2×2 grid suggests.
- Corporate StrategyH. Igor Ansoff (McGraw-Hill, 1965). The book-length expansion of the matrix framework, including how to think about competitive advantage and strategic capability across growth directions. The matrix is one tool in a larger system here.
- Good Strategy / Bad StrategyRichard Rumelt (Crown Business, 2011). The best companion read to the Ansoff Matrix: where Ansoff identifies which direction to bet, Rumelt explains what it actually takes to build a strategy that wins once you’ve chosen the direction.
Sources: H. Igor Ansoff, “Strategies for Diversification,” Harvard Business ReviewVol. 35, No. 5, September, October 1957, pp. 113 to 124. Ansoff, Corporate StrategyMcGraw-Hill, 1965. Wikipedia, “International expansion of Netflix”, confirms Netflix entered Canada in 2010, expanded to Latin America and the Caribbean in September 2011, and entered Europe in 2012. BusinessTats, “Amazon Statistics 2026”, confirms AWS launched in 2006 and generated approximately $107 billion in 2024 revenue. Puyt, R.W. “Setting the Record Straight: The Intellectual Legacy of H. Igor Ansoff (1918 to 2002),” Strategic Change2025, confirms Ansoff’s PhD in mathematics from Brown University in 1948, his work at the RAND Corporation, and his move to Lockheed Aircraft Corporation’s Corporate Planning Department in 1957. Corporate Finance Institute Ansoff Matrix explainer. WorkBoard, “Ansoff Matrix: Framework for Business Growth” (October 2024).
Brian Kasday spent forty years in direct-response marketing before rebuilding the whole operation as a one-person shop. He writes The Operator’s Library — including “Build a Complete Marketing Department” — for operators who’d rather build it themselves than wait on someone else.
Build the department these ideas describe — the free companion kit: mmsvegas.com/resources.
More The Operator's Canon guides
Free · Operator Toolkit
Want the tools, not just the guide?
Get the free operator toolkit — templates and checklists for the systems you actually run, plus a note when this guide changes.
Get the free toolkit →