
Last updated: July 2026
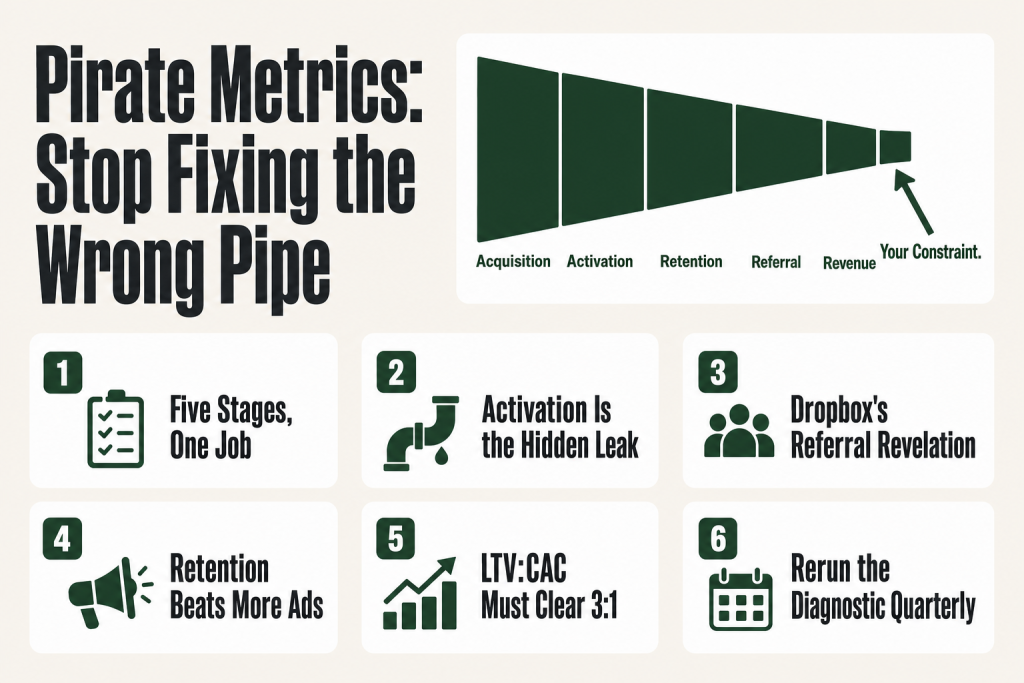
Pirate metrics, the AARRR framework, is the simplest useful diagnostic in marketing, and most small-business operators have never actually used it. By the end of this page, you’ll be able to look at your own numbers, point to the one stage that’s limiting your growth right now, and stop pouring money into stages that aren’t the problem.
Here’s what usually happens instead. Revenue is flat, so the instinct is to run more ads. More ads bring more visitors. Revenue is still flat. So you try better ads, different channels, a new offer. Still flat. The problem was never acquisition. It was that the people you were already getting weren’t converting past the first interaction, or they were converting but not coming back, or they came back but never spent enough to cover what you paid to get them. You were fixing the wrong pipe.
That’s exactly the waste AARRR was built to prevent. It doesn’t tell you what to do. It tells you where to look, and that turns out to be most of the battle.
The idea in 30 seconds
- Pirate metrics (AARRR) is a five-stage growth diagnostic: Acquisition, Activation, Retention, Referral, Revenue, each measured as a conversion rate between stages.
- The point is not to track all five. The point is to find which one stage is your current constraint and fix that before touching anything else.
- Most operators default to spending more on acquisition when the real problem is activation or retention, a mistake AARRR makes visible fast.
- Dropbox’s referral program is the canonical example: paid acquisition via Google AdWords cost between $233 and $388 per customer for a $99 annual product. Drew Houston presented at the 2010 Startup Lessons Learned conference that a double-sided referral program permanently grew signups by 60%, with 35% of daily signups flowing through it at peak.
- For small businesses, this framework works without a data team, a spreadsheet tracking weekly numbers at each stage is enough to spot the leak.
- Bottlenecks shift over time; re-run the diagnostic quarterly, not once.
Where Pirate Metrics Came From
Dave McClure, a marketer who’d worked at PayPal before going on to found 500 Startups, gave a short talk at Ignite Seattle on August 8, 2007, titled ‘Startup Metrics for Pirates.’ The name was a pun: AARRR said aloud sounds like a pirate. He was not subtle about this.
What he was responding to was real: most startups tracked either nothing or the wrong things, page views, social followers, press mentions. Metrics that felt like progress but told you nothing about whether the business was actually working. His argument was that there are only five numbers that matter, they map to five stages of the customer lifecycle, and measuring all five shows you exactly where growth is leaking.
The framework spread partly because it gave cross-functional teams a shared language. Instead of subjective debates about priorities, you could point to the numbers and say: ‘Our activation rate is 18%. Acquisition is fine. We fix activation next.’ That’s a conversation with a clear answer, and that kind of clarity is rare in a small company where everyone thinks their problem is the most urgent one.
The Five Pirate Metrics, Defined for Operators
Each stage is a conversion rate, the fraction of people who make it from one step to the next. You’re not looking for absolute numbers; you’re looking for the ratio that drops off a cliff.
Acquisition
How do people find you? Organic search, paid ads, referrals, word of mouth, cold outreach, trade shows, all of it. Your acquisition metric is the volume and cost of new visitors or leads entering your world. This is the stage most operators over-optimize. If you’re spending money on advertising and your downstream numbers are broken, more acquisition just pours water into a leaking bucket.
Key numbers: total new visitors or leads by channel, cost per lead, conversion rate from ‘stranger’ to ‘first contact.’
Activation
Did the first experience deliver enough value that the person decided to stay? This is the most under-tracked stage for small businesses, and it’s frequently the biggest bottleneck. Activation looks different depending on your model: for a B2B SaaS product it might be completing a key integration or reaching a usage threshold, Slack’s team famously discovered that organizations which exchanged 2,000 messages had a 93% likelihood of continuing to use the product long-term, so they designed every onboarding step to get teams there as fast as possible. For a service business, activation might be booking a consultation or completing an intake. For e-commerce, it’s often placing that first order.
The activation moment is the point at which someone goes from ‘curious’ to ‘I get it.’ Everything before that is acquisition. Everything after is retention. The gap between those two states is where most businesses quietly bleed.
Retention
Do they come back? For a subscription, this is churn. For a service business, it’s repeat appointment rate. For e-commerce, it’s second-purchase rate. Retention is arguably the most economically important stage, a customer you keep costs a fraction of what a new one costs to acquire, but operators focus on acquisition because it’s more visible and feels like forward motion.
If your retention is poor, fixing acquisition is not a growth strategy. It’s a treadmill.
Referral
Do your customers tell others? Referral is the stage that turns a business into a compounding growth engine rather than a linear one. This doesn’t have to be a formal program, it can be word of mouth, online reviews, or professional recommendations. But if you’re not measuring it, you’re not managing it.
For B2B, referral often looks like customer references, case studies, and partner introductions rather than a promo code mechanic. The economics are similar either way: a referred customer typically costs less to acquire and converts at a higher rate than a cold one.
Revenue
Are they paying, and is the amount sustainable? The key metrics here are average revenue per customer, customer lifetime value, and the ratio of that lifetime value to your customer acquisition cost. If LTV:CAC sits below 3:1, you have a revenue-stage problem even if everything else looks functional.
Dropbox: The Canonical Referral Diagnosis
Before going further into how to apply the framework, it’s worth pausing on the example that made AARRR famous, because the lesson isn’t just ‘build a referral program.’ It’s about what the diagnostic actually revealed.
Dropbox’s early Google AdWords campaigns cost between $233 and $388 per acquired customer, for a product priced at $99 per year. Structurally upside-down. The constraint wasn’t activation (people who tried Dropbox understood it quickly) and it wasn’t retention (cloud storage solved a continuous need). The constraint was the cost of acquisition itself.
Their answer was to engineer the Referral stage: a double-sided program offering 500MB of free storage to both referrer and new user, embedded directly into onboarding. Drew Houston presented at the 2010 Startup Lessons Learned conference that the program permanently increased signups by 60%, and that 35% of daily signups came through the referral program at its peak. From 100,000 registered users at launch in September 2008, Dropbox reached 4,000,000 by early 2010, roughly 15 months later.
One fix at one stage. That’s the whole point of the framework: you don’t improve all five levers simultaneously. You find the one that’s binding and pull it.
The Only Question That Actually Matters: Where Is the Constraint?
AARRR is not a reporting framework. You’re not supposed to track all five numbers, build a dashboard, and call it a day. The whole exercise is constraint-finding.
The logic echoes the Theory of Constraints: every system has one bottleneck that limits overall throughput. Improving any stage other than the bottleneck produces almost no improvement in the final output. In AARRR terms, if your activation rate is 12% and your retention rate is 80%, spending six months on retention programs does almost nothing, because the constraint is earlier. Most people who enter your world aren’t sticking around long enough to retain.
The drill is simple: calculate the conversion rate between each consecutive stage. Find the one that drops the hardest. That’s your constraint. Fix it. When it improves to something reasonable, run the diagnostic again, because the constraint will have shifted.
This re-running matters. A lot of operators fix one stage, feel good, and stop looking. The bottleneck migrates. Once activation improves from 15% to 35%, the binding constraint may move to retention or revenue. The system is dynamic, which is why this needs to be a quarterly habit, not a one-time project.
A practical heuristic: early-stage businesses almost always have activation problems, they’re getting traffic but not delivering a good enough first experience. Mid-stage businesses often have retention problems, they’ve figured out acquisition and activation but customers aren’t coming back. Mature businesses often hit referral or revenue problems, they’ve retained a large base but aren’t generating enough word-of-mouth to sustain growth without expensive paid acquisition. None of that is a rule. It’s a starting point.
Putting this to work? The ideas in the Canon are the foundation under the tactical playbook in Build a Complete Marketing Department — grab the free companion kit at mmsvegas.com/resources.
More Examples: B2B, SaaS, and Service Businesses
A B2B SaaS example: the activation audit. Consider a mid-market project management tool that’s growing its trial signups through content marketing, solid inbound acquisition, but seeing fewer than 20% of trials convert to paid. The conversion rate math points straight at activation. When the team digs in, they find that most trial users created an account, poked around for a few minutes, and never invited a teammate. No teammate invitation means no collaboration. No collaboration means the product never demonstrated its core value. The fix isn’t a better landing page or a cheaper price point, it’s redesigning onboarding to get that first teammate invited within the first session. That one behavioral threshold, reached or not reached, is doing most of the work on whether someone converts. It’s Slack’s 2,000-message insight applied to a smaller product.
A service business example. Take a residential HVAC installer. They run Google Ads well (acquisition), convert inquiries to booked jobs reliably (activation), and their work quality is high. But repeat service rates are poor and almost no jobs come from referrals. The constraint sits in Referral and Retention, nobody’s offering the maintenance agreement, nobody’s following up 12 months later to suggest a tune-up. Pouring more money into Google Ads doesn’t solve this. Building a post-job follow-up sequence and a simple referral ask does. The framework makes that obvious once you actually look at the numbers by stage.
A B2B professional services example. An accounting firm growing mostly through cold outreach has decent acquisition and strong activation, nearly every discovery call turns into an engagement. But their referral rate is close to zero. Clients are satisfied, just never prompted. A single post-engagement email asking: ‘Do you know one other founder who’d benefit from this kind of support?’, sent at the moment the client files their first clean return, can move that number meaningfully. The stage was never structurally broken. It was just unmanaged.
How to Apply Pirate Metrics in Your Business Today
You don’t need a data team. You need a spreadsheet and a willingness to define each stage concretely for your specific business model.
Step 1: Define each stage in your own terms
Don’t use generic definitions. Write down, specifically, what an event at each stage looks like for you. Examples:
- Acquisition: New unique visitors to the website; new leads from ads; new inbound phone calls.
- Activation: Completed a consultation call; placed a first order; signed up for a trial and logged in at least twice.
- Retention: Made a second purchase within 90 days; re-booked a service appointment; opened 3 of the last 5 emails and clicked at least once.
- Referral: Submitted a review; used a referral code; answered ‘yes’ to ‘Did someone refer you?’ in intake.
- Revenue: Average order value; monthly recurring revenue; LTV-to-CAC ratio.
If a stage can’t be observed and counted, it’s not a metric, it’s a guess.
Step 2: Pull the numbers for the last 90 days
You want a count at each stage and the conversion rate between consecutive stages. A simple table:
| Stage | Count (last 90 days) | Conversion to next stage |
|---|---|---|
| Acquisition | 1,200 visitors | 8% → Activation |
| Activation | 96 first purchases | 22% → Retention |
| Retention | 21 repeat customers | 19% → Referral |
| Referral | 4 referred new customers | |
| Revenue | $4,100 avg. LTV | LTV:CAC = 2.1:1 |
In that example, activation at 8% is probably the constraint, but you’d also flag the LTV:CAC of 2.1:1 as a revenue-stage warning. Fix activation first; then look at pricing or upsell structure to improve revenue per customer.
Step 3: Fix one thing
Pick the leakiest stage. Write down three hypotheses for why it’s leaking. Test one. Measure for four to six weeks. This isn’t sophisticated, it’s directed attention versus scattered attention. Most small businesses don’t fail because they lack resources; they fail because they spread what they have across five problems simultaneously and fix none of them.
Step 4: Use AI as a hypothesis-generator, not a replacement for the data
Once you know your constraint, describe your business and your stage numbers to a tool like ChatGPT or Claude and ask for ten possible reasons that stage is underperforming. You’ll get several ideas you’d already considered and a few you hadn’t. Which hypotheses are plausible, and which experiments are worth running, that judgment stays with you. The AI helps you think faster; it doesn’t think for you.
Where Pirate Metrics Works Best, and Where It Doesn’t
AARRR works best when your business has a clear, repeatable customer path you can instrument. That includes e-commerce, subscription businesses, SaaS, service businesses with recurring clients, and any business with a lead-to-sale process you can observe stage by stage.
It works less well, or needs adaptation, in a few situations:
Long, complex B2B sales cycles. When the path from first contact to signed contract takes 18 months and involves five decision-makers, the five stages get compressed and blurry. ‘Activation’ in a 200-person SaaS procurement process might mean ‘champion completed an internal proof-of-concept and presented to the VP,’ not a product trial event. You can still use the framework, it just requires that you translate each stage carefully into your actual sales motion rather than importing the consumer-app definitions wholesale. Enterprise sellers who’ve done this often end up tracking stage-to-stage pipeline velocity rather than conversion rates, which is a useful adaptation.
Early-stage businesses with almost no data. If you have 40 customers, your conversion rates are noise. At that stage, talking to the people who activated versus the people who didn’t tells you more than any funnel math. A rough rule of thumb: you need at least 50 to 100 events at each stage before the ratios mean anything.
Brand-heavy businesses where trust builds over time. If your business grows primarily through reputation and long-term relationship-building, think a boutique M&A advisory firm or a high-end architecture practice, forcing everything into a five-stage behavioral funnel misses how those relationships actually develop. You can supplement AARRR with brand tracking, but don’t mistake a brand constraint for an activation problem.
One-time-purchase, non-recurring businesses. If your product is inherently a one-time buy, a custom wedding cake, a residential home purchase, retention and referral look very different from a subscription model. Referral becomes disproportionately important, and ‘retention’ shifts to mean lifetime value from the same customer’s network rather than repeat purchases from that individual.
Common Misunderstandings About Pirate Metrics
‘More tracking is better.’ The framework’s value comes from focus, not measurement volume. If you track 47 metrics across five stages, you’ve replaced one kind of confusion with another. Each stage needs one or two numbers that are genuinely predictive. Picking them requires judgment and customer knowledge, no dashboard tool does that for you automatically.
‘The stages are always in AARRR order.’ Real customer journeys are not linear. A customer might refer friends before their second purchase. A customer might generate revenue via an upsell before they’ve shown retention behavior. The acronym is a mnemonic, not a strict sequence. Use it to organize thinking, not to dictate the order in which you build things.
‘This only works for digital or SaaS businesses.’ The framework originated in the tech-startup world, but the logic applies to any business with a repeatable customer lifecycle. A dental practice has acquisition (new patient inquiries), activation (first appointment completed), retention (annual recall visits), referral (referred new patients), and revenue (average lifetime spend). The numbers are different; the structure is identical.
‘Fixing a stage means running more campaigns at that stage.’ Sometimes the fix is a campaign. More often it’s a structural change to the experience itself, how a customer is onboarded, how follow-up is timed, what the referral mechanic actually is. Operators who treat AARRR as a media-buying framework miss most of the leverage available to them.
Common Mistakes
- Defaulting to more acquisition when the real leak is downstream — Run the full five-stage conversion calculation before spending anything on acquisition. If activation or retention is broken, fix that first, more traffic through a leaking funnel just burns faster.
- Defining stages too vaguely to measure — Write out a specific, observable event for each stage before you pull any numbers. ‘Had a good first experience’ is not a metric. ‘Booked a second appointment within 60 days’ is.
- Running the diagnostic once and never revisiting it — Set a calendar reminder to re-run the five-stage conversion table quarterly. Bottlenecks shift as you fix them, last quarter’s solved problem is often next quarter’s blind spot.
- Tracking too many metrics per stage — Limit yourself to one or two numbers per stage that are genuinely predictive of business health. A 47-metric dashboard replaces one kind of confusion with another.
- Treating referral as a final-stage luxury — Build a simple, explicit referral ask into the post-purchase or post-service experience from day one, for local and service businesses especially, a working referral mechanic often cuts effective CAC faster than any ad optimization.
Operator’s Take
Here’s the failure mode I see most often: someone runs the diagnostic, correctly names their constraint, and then immediately starts testing. They’re changing button colors before they’ve written a single sentence explaining why the stage is leaking. So here’s what to do instead, in order.
Call five people before you touch anything. If your activation rate is 8%, your first move is to call five people who signed up or inquired but never converted past that stage. Not a survey, a phone call. You’ll hear one of three things: they didn’t understand the value fast enough, the friction was too high to bother, or something in the experience felt off. Each of those is a completely different problem with a different fix. Button color doesn’t address any of them.
Write the hypothesis before you run the test. Before you restructure an onboarding email, adjust pricing, or rework a landing page, write this sentence down: ‘I believe [Stage X] is leaking because [specific reason], and I’ll know the test worked if [specific metric] moves by [specific amount] within [specific time window].’ Most operators skip it because writing it down makes obvious they don’t actually have a hypothesis, they have a hunch dressed as a plan. Force the discipline. A written hypothesis takes five minutes and saves weeks of running tests that can’t tell you anything because the success condition was never defined.
On activation: find the behavioral threshold, not just the completion event. The Slack 2,000-message finding is the model. They didn’t optimize for ‘account created’ or even ‘first message sent.’ They found the specific depth of usage that predicted whether a team would stay. For a B2B SaaS tool, that threshold might be ‘invited a second teammate and created three projects within 7 days.’ For a service business, it might be ‘attended the follow-up call, not just the intake.’ Look at your retained customers versus your churned ones and ask: what did the retained group do in the first week that the churned group didn’t? That’s your activation target. Then redesign onboarding to drive people toward it.
On referral: don’t wait until everything else is perfect. Standard advice says fix retention before you invest in referral. That’s correct for a subscription SaaS product. For a local service business, a plumber, an accountant, a gym, a well-timed referral ask often moves faster than anything else. The mechanic doesn’t need to be complex: ask at the right moment (right after a clear win, not at billing), make the ask specific (‘Do you know one other business owner who struggles with X?’), and give the referrer something that actually matters to them. A 15 to 20% lift in referred new customers from a thin-margin local business changes the unit economics in a way that ad optimization can’t match.
On revenue: fix LTV:CAC before you scale. If your ratio is below 3:1, don’t pour fuel on acquisition. It won’t improve the math, it’ll just make the deficit bigger faster. Run the revenue calculation first: average order value, purchase frequency, and the one pricing or packaging change most likely to move one of those levers without requiring new customers. Often the answer is a maintenance plan, a retainer, a bundle, or a rate increase you’ve been avoiding. Get the unit economics right at your current volume. Then scale.
The quarterly re-run is not optional. Set a calendar event, 90 minutes, same spreadsheet, same five calculations. A business that fixed activation in Q1 often surfaces a referral problem by Q3 that wasn’t visible before. That’s not failure. That’s the system working. The operators who fall behind are the ones who ran the diagnostic once, fixed one thing, and never looked again.
Used in
- ✓ Build a Complete Marketing Department
Used to structure the diagnostic layer of a small-business marketing system, helping operators identify which stage of the customer lifecycle deserves attention before allocating budget or headcount. - ✓ The Missing Manual for FunnelKit
Applied to map funnel stages to specific automation sequences, each AARRR stage corresponds to a discrete flow or trigger within FunnelKit’s pipeline structure. - ✓ The Missing Manual for Make
Used to design automated data-collection and alert scenarios that surface stage-level conversion drops before they become expensive, e.g. a Make scenario that flags when weekly activation rate falls below a defined threshold.
FAQ
Do I need analytics software to use pirate metrics?
No. A spreadsheet updated weekly is enough for most small businesses. You just need to count events at each stage, website visitors, first purchases, repeat purchases, referrals, revenue per customer. The math is simple division. Fancy dashboards help at scale, but they’re not what makes the framework useful.
What’s the most commonly broken stage for small businesses?
Activation is underperforming far more often than operators realize. Most small businesses have decent acquisition, they’re getting traffic or leads, but a poor first experience that fails to convert visitors into committed customers. Check your activation numbers before assuming you need more leads.
Is AARRR only for tech startups?
It originated there, but the logic applies to any business with a repeatable customer lifecycle. A dental practice, a restaurant, a law firm, a gym, all have acquisition, activation, retention, referral, and revenue stages. The specific metrics are different; the constraint-finding discipline is identical.
How often should I run the diagnostic?
Quarterly is a good default. Monthly if you’re in a fast-changing environment or you’ve just made a significant change to one stage. The bottleneck shifts as you fix things, so the diagnostic needs to be a recurring habit, not a one-time exercise.
What’s the difference between pirate metrics and the Marketing Hourglass?
The Marketing Hourglass (Know, Like, Trust, Try, Buy, Repeat, Refer) is a customer experience framework that describes how relationships develop over time. Pirate metrics is a measurement and diagnostic framework. They complement each other: the Hourglass tells you what the journey should feel like; AARRR tells you where it’s breaking down.
Should I use AARRR or a North Star Metric?
Both, for different purposes. AARRR is a diagnostic, it helps you find which stage is the current constraint. A North Star Metric is a coordination tool, one number that signals whether the overall business is healthy and that every team can optimize toward. They serve different functions and work well together.
Further reading
- ‘Startup Metrics for Pirates’ (Dave McClure, August 2007, Ignite Seattle)the original source; still findable on SlideShare; remarkable how little the core argument has aged.
- North Star Metric ExplainedThe Operator’s Canonfor understanding how AARRR’s five-stage view collapses into a single coordination metric at a more mature stage of business.
- CAC to LTV Ratio ExplainedThe Operator’s Canonthe unit economics lens that sits underneath AARRR’s Revenue stage and tells you whether the funnel’s output is actually profitable.
Sources:
Dave McClure, ‘Startup Metrics for Pirates’ presentation, Ignite Seattle, August 8, 2007 (500hats.typepad.com post dated August 9, 2007 confirms date and venue; YouTube upload by Tangled Web Ventures confirms title as ‘Ignite Seattle 2007-8-8’). Drew Houston, ‘Fast Growth and Lessons Learned: The Dropbox Story,’ Startup Lessons Learned conference, 2010, primary source for the 60% permanent signup increase, 35% of daily signups through the referral program, and the 100,000-to-4,000,000 user growth figure; presentation slides preserved at SlideServe and corroborated by Viral Loops, Andrew Chen (andrewchen.com), Waitlister.me (April 2026), Predictable Profits, and Stratrix. The $233, $388 CAC range against a $99 product appears in Drew Houston’s own presentation slides (SlideServe transcript) and is independently cited by Andrew Chen, Viral Loops, and Waitlister.me. Stewart Butterfield, quoted in GrowthHackers Slack growth study, primary source for the 2,000-message activation threshold and 93% retention figure (‘after 2,000 messages, 93% of those customers are still using Slack today’), corroborated by IdeaPlan.io, june.so activation playbook, and digitalheroesco.com.
Brian Kasday spent forty years in direct-response marketing before rebuilding the whole operation as a one-person shop. He writes The Operator’s Library — including “Build a Complete Marketing Department” — for operators who’d rather build it themselves than wait on someone else.
Build the department these ideas describe — the free companion kit: mmsvegas.com/resources.
More The Operator's Canon guides
Free · Operator Toolkit
Want the tools, not just the guide?
Get the free operator toolkit — templates and checklists for the systems you actually run, plus a note when this guide changes.
Get the free toolkit →