
Last updated: October 2026
The pareto principlecommonly called the 80/20 rule, is the observation that, in most systems, a small fraction of inputs produces the majority of outputs. Pull your own numbers and you can identify the customers, offers, and channels doing the real work in your business, then make sharper decisions about where to concentrate time and money.
Most operators already sense this. They know their best customers feel different, that one or two offers convert while the rest just sit there, that one channel actually brings buyers while the others bring activity. The pareto principle gives that intuition a framework and, more importantly, a discipline: run the numbers, name the vital few, build strategy around them rather than around the whole portfolio.
That said, this is one of the most frequently misapplied ideas in business. People turn it into a law when it’s an observation. They fire the bottom 80% of customers when they should be studying them. They quit channels entirely when concentration, not abandonment, was the answer. The idea is simple. The application is where judgment actually matters.
The idea in 30 seconds
- The pareto principle observes that a small minority of causes, often around 20%, produce the majority of effects. The 80/20 numbers are a useful shorthand, not a guaranteed ratio.
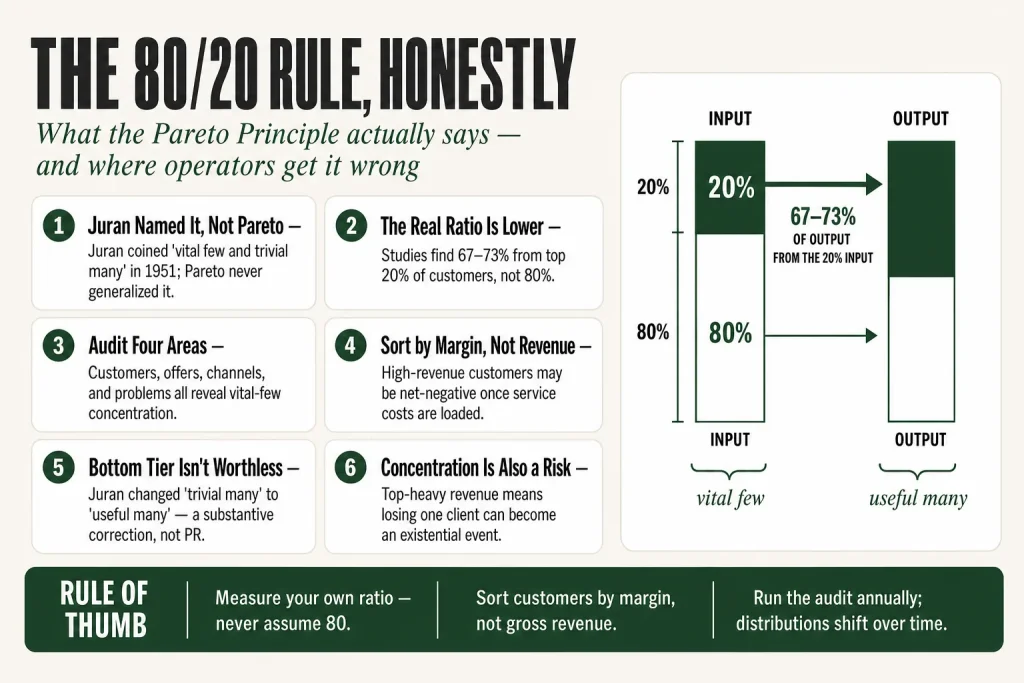
- Vilfredo Pareto documented unequal wealth distribution in his 1896 to 97 Cours d’économie politique. Joseph Juran, not Pareto, turned that observation into a management tool, named the principle, and coined ‘the vital few and the trivial many’ in his Quality Control Handbook (McGraw-Hill, 1951). He later admitted the naming was his mistake in Quality Progress (Vol. 8, No. 5, May 1975, pp. 8 to 9).
- For an operator, the principle shows up in customers (a few drive most revenue), offers (a few products carry the load), channels (a few sources bring real leads), and problems (a few root causes create most complaints).
- The right response is to find your vital few, protect and build on them, then decide deliberately what to do with the rest, not reflexively cut everything else.
- Treating 80/20 as a law rather than a tendency is the most common mistake. Peer-reviewed studies put the real ratio closer to 67 to 73%, and it shifts over time.
Where the Pareto Principle Came From
Two people built this idea, and conflating them causes real confusion about what the principle actually claims.
Vilfredo Pareto (1848 to 1923) was an Italian economist who, in his 1896 to 97 Cours d’économie politiquedocumented that a small share of the population owned the overwhelming majority of Italy’s land, and found similar patterns of unequal distribution in every other country he examined. What he documented was a mathematical structure, specifically a non-normal, power-law distribution. He never generalized it into a universal management rule. That matters, because a lot of what we now call the ‘Pareto principle’ has nothing to do with what Pareto was actually working on.
The management application came from Joseph M. Juran (1904 to 2008), a Romanian-born American engineer and quality management pioneer. Juran came across Pareto’s models around 1941. In his Quality Control Handbook (1st ed. McGraw-Hill, 1951), the book that became the standard reference on quality management, he showed that quality losses in manufacturing trace back to a small number of causes, labeled that pattern ‘Pareto’s principle of unequal distribution,’ and coined the phrase ‘the vital few and the trivial many.’ That phrase, and the generalization of the pattern to any system, was Juran’s contribution.
He later had second thoughts about the name. In ‘The Non-Pareto Principle; Mea Culpa’ (Quality ProgressVol. 8, No. 5, May 1975, pp. 8 to 9), Juran publicly conceded that attaching Pareto’s name to the generalization was his own mistake. Pareto had studied wealth distribution; Juran was the one who proposed it was universal. So the principle we use today, the idea that any population contributing to a common effect will show dramatic concentration in a vital few, is Juran’s intellectual contribution, named after someone whose work inspired it but who never made that leap.
Juran also softened ‘trivial many’ to ‘useful many’ in his later work, specifically to discourage treating the bottom tier as having no value at all. That shift was a substantive correction, not just a PR move, and we’ll come back to it.
The principle reached a wider business audience through Richard Koch’s The 80/20 Principle (Nicholas Brealey Publishing, 1997), which extended the idea beyond quality control into business strategy, time management, and personal productivity.
The Problem It Was Built to Solve
Every operator has finite resources: time, cash, headcount, attention. The instinctive response to that constraint is to spread resources evenly, give every customer the same service level, invest in every marketing channel proportionally, fix every product complaint as it arrives. It feels fair. It also tends to produce mediocre results across the board, because you’re diluting effort across inputs that have wildly different payoff rates.
The pareto principle forces the question: which inputs are actually producing results? Not which ones feel important, not which ones require the most energy, not which ones showed up first in your CRM, which ones are producing. The answer, in most businesses, is a shorter list than you’d expect.
Juran’s manufacturing version was precise: fix the 20% of defect types causing 80% of losses and you get a dramatic quality improvement from limited resources. The business-marketing version is less precise but directionally the same: concentrate on the customers, offers, channels, and problems that are actually working, and you get a much better return on the same inputs. The problem the pareto principle was built to solve is dilutionthe tendency to treat every input as equally worth your attention when they demonstrably are not.
What the Pareto Principle Actually Says (and Doesn’t Say)
Let’s be clear about what the principle is and isn’t, because the popular version is a bit loose.
What it says: In many systems, a minority of causes produce a majority of effects. The distribution is unequal, often dramatically so. You can expect concentration.
What it doesn’t say: The ratio won’t be exactly 80/20. Studies measuring the actual ratio across industries consistently find the concentration is real but the 80 figure is inflated. Baek Jung Kim, Vishal Singh, and Russell S. Winer, in ‘The Pareto Rule for Frequently Purchased Packaged Goods: An Empirical Generalization’ (Marketing LettersVol. 28, No. 4, December 2017, pp. 491 to 507), studied 22 consumer-packaged-goods categories using six years of purchase data and found the mean Pareto ratio at the brand level was 0.73, meaning 73% of sales came from the top 20% of customers, not 80%. Daniel M. McCarthy and Russell S. Winer, in ‘The Pareto Rule in Marketing Revisited: Is It 80/20 or 70/20?’ (Marketing LettersVol. 30, No. 2, June 2019, pp. 139 to 150), applied the same framework to a dataset of 339 publicly traded non-CPG companies and found the top 20% of customers accounted for an overall average of 67% of sales, with non-subscription businesses at 68% and subscription businesses at 59%. The concentration is real and consistent across industries. The canonical 80 is a ceiling most businesses don’t hit. Treating it as a precise prediction and being surprised when your audit shows 68/20 is a category error.
It also doesn’t say that the other 80% is worthless. Juran was explicit about this, his shift from ‘trivial many’ to ‘useful many’ was a substantive correction, intended to discourage treating the bottom-tier contribution as valueless. The bottom tier often provides revenue stability, volume that supports fixed-cost coverage, and the breadth of data that reveals patterns. Not worth the same investment per unit, but that’s different from worthless.
Think of the principle less like a rule and more like a diagnostic prompt: go look at the distribution in your own data. The number you find will tell you something specific about your business. Act on that number, not on a canonical figure that doesn’t apply to your situation.
The four places an operator runs the audit
- Customers: Which customers account for most of your revenue, profit, or lifetime value? This is the most common application and the most actionable starting point.
- Offers: Which products or services drive the bulk of revenue or margin? Strip out the noise from product lines that exist for historical or ego reasons rather than business ones.
- Channels: Which acquisition sources deliver leads that actually convert, retain, and pay? Not which ones have the most impressions or activity, which ones produce buyers.
- Problems: Which customer complaints, support tickets, or churn reasons appear most often? A small number of recurring root causes typically generate the bulk of operational friction.
Why the Imbalance Exists in the First Place
Power-law distributions, where a small number of inputs produce outsized outputs, appear across natural and economic systems. The mathematical underpinning is the Pareto distribution, which describes any phenomenon where each unit doesn’t contribute equally but multiplicatively. Wealth accumulates to wealth. Popular products attract more attention, which makes them more popular. Channels that already convert well have higher quality scores and better targeting data, which makes them convert better still. The imbalance isn’t random noise; it tends to compound.
In a small business context, this shows up in a few recognizable ways. Your best customers often refer others like themselves, buy more over time, complain less, and cost less to serve, so they’re better than their revenue share alone suggests. Your worst-fitting customers do the reverse. The gap between the top tier and the bottom tier widens the longer you serve them.
A channel that works often works because the audience quality is high, people who have the right problem, the right budget, and the right level of awareness. A channel that doesn’t work tends to keep not working regardless of how much you adjust creative, because the audience composition isn’t right. The principle isn’t just describing a snapshot of today; it’s pointing at underlying structural differences that tend to persist.
That’s the operator implication: the concentration you find isn’t an accident. It reflects structural alignment between what you do and who you do it for. Finding your vital few tells you where that alignment is strongest, and that’s exactly where strategy should start.
Putting this to work? The ideas in the Canon are the foundation under the tactical playbook in Build a Complete Marketing Department. Grab the free companion kit at mmsvegas.com/resources.
Running Your Own Pareto Audit
The mechanics are genuinely simple. The judgment is what takes real work.
Step 1: Pull the right data
Start with revenue by customer over the last twelve months. Sort descending. Mark the top 20% of customers by count and see what percentage of revenue that group represents. Don’t be surprised if it’s not 80%. The research on real business data suggests you’ll more likely land somewhere between 65% and 75%, depending on your industry and business model. In B2B service businesses you sometimes find the top 20% is closer to 85 to 90% of revenue. The number you find is your number, and it’s more useful than any canonical figure.
Now do it for margin, not just revenue. A customer who accounts for 15% of your revenue but 3% of your margin is a very different story than one who accounts for 8% of revenue and 14% of margin. Revenue is easy to pull; margin is where the real picture lives.
Step 2: Characterize the vital few
Who are these customers, specifically? What do they have in common? Industry, company size, geography, how they found you, what problem brought them in, what offer they started with? The goal isn’t a spreadsheet, it’s a profile. If you can describe your top-20% customer clearly enough that a salesperson could identify one on a call, you’ve done the work.
This profile is your best acquisition target. Finding more people who look like your existing top tier is almost always more efficient than trying to convert people who look like the bottom tier. This is how the pareto principle connects directly to your needs-based segmentationthe vital few aren’t just bigger spenders, they’re usually people whose underlying need fits your offer most precisely.
Step 3: Run the same audit on offers and channels
Do your products or service lines. Which ones carry most of the revenue and margin? Which ones exist because they were good ideas five years ago or because a single customer asked for them? Complexity in the offer menu has a real cost: more to explain, more to train on, more to support, more to maintain.
Do your acquisition channels. Pull leads or new customers by source over the same twelve-month window. Then filter by which sources produced customers who stayed, paid, and grew rather than customers who churned in ninety days. Traffic and lead volume are vanity metrics for this exercise. Retained, profitable customers are the measure.
Step 4: Decide what to do with the bottom tier
This is where most operators get it wrong in both directions. Some ignore the bottom tier entirely and miss the fact that it still represents real revenue and often contains early signals of new growth. Others try to drag every bottom-tier customer up to top-tier status through heroic service effort, which doesn’t work because the fit isn’t there.
The more useful frame: decide deliberately rather than by default. The bottom tier might be fine to serve as long as you’re not subsidizing them with resources that belong to the top tier. Some operators find that the bottom 20% by margin are actually losing money once you fully load the service costs. Firing those customers, politely, intentionally, and redeploying that capacity is one of the highest-ROI moves available to a small operator.
Where the Pareto Principle Is Most Useful Today
The idea earns its keep in a few specific situations that come up regularly for small operators.
Customer tiering decisions. When you’re deciding how much service, attention, or personalization to allocate, knowing the revenue and margin distribution tells you where to concentrate. This doesn’t mean ignoring smaller customers, it means designing systems that serve them efficiently so your high-touch capacity goes to the accounts that justify it. The service profit chain logic reinforces this: exceptional delivery for the right customers drives loyalty and referrals far more than adequate delivery for everyone.
Channel investment decisions. Digital marketing has made it easy to be active on many channels simultaneously. Pareto analysis is the corrective: pull the data, find which one or two channels are producing real customers, and ask seriously whether the others deserve equal investment. Doubling down on the channel that already works often beats launching a new one. The direction of this concentration pattern is consistent across studies, even if the precise ratio varies by category and business model.
Product and offer simplification. Growing businesses accumulate product lines the way houses accumulate junk. A Pareto audit on your offer menu often reveals that two or three products are carrying the business while six others absorb support, inventory, and sales complexity. Cutting or parking the low-performers, or restructuring pricing so they’re self-service rather than hand-held, frees up enormous capacity.
Complaint and churn root-cause analysis. This is the Juran application in its original form. Run a frequency count on churn reasons, support ticket categories, or complaint types. You’ll find that a small number of recurring root causes are responsible for most of the friction. Fix those first before building new retention programs on top of a leaky foundation. This pairs directly with the leaky bucket model: the pareto principle tells you which holes in the bucket are biggest.
Content and SEO concentration. In content marketing, organic traffic tends to concentrate in a small fraction of pages. Identifying those pages and investing in their depth, freshness, and internal linking before creating more new content is a Pareto move. The pillar cluster model is, in part, an application of this logic, concentrate authority rather than diffuse it.
Where the 80/20 Rule Gets Operators Into Trouble
The pareto principle is a diagnostic, not a strategy in itself. People who treat it as a complete strategy tend to make a few predictable mistakes.
Cutting the bottom tier too aggressively, too soon. The customers who look small today may be early in a relationship that grows. A subscription business that fires every customer below a revenue threshold is also firing potential multi-year accounts, referrers, and case study subjects. The audit should inform triage, not an automatic culling.
Applying it to relationships that don’t work this way. Not every business situation has a power-law structure. If your customers genuinely need roughly equal service, think commodity supply, regulated industries, or businesses where volume breadth matters, the principle can lead you toward concentration risk rather than efficiency. This is the flip side of Pareto-style focus: when too large a share of revenue concentrates in too few accounts, losing one becomes an existential event. Focus and the diversification that makes a business durable are in real tension here.
Using it to justify ignoring channels that need time to mature. A channel that’s been active for three months will look weak in a Pareto audit even if it’s the right long-term bet. The principle works on stable, mature data, not on early signals. Be careful pulling the plug on something new because it’s not yet in the top 20%.
Treating the ratio as a fixed number. Distributions shift. A customer tier that accounts for 80% of revenue today might be 60% in two years as new segments grow. Run the audit on a regular cadence, not once as a founding exercise.
What People Get Wrong About the Pareto Principle
Misunderstanding 1: The ratio is always 80/20. It’s not. Kim, Singh, and Winer’s 2017 study in Marketing Letterscovering 22 CPG categories and six years of purchase data, found the mean Pareto ratio at the brand level was 0.73, not 0.80. McCarthy and Winer’s 2019 follow-up in the same journal, covering 339 publicly traded non-CPG companies, found an overall average of 67%, with non-subscription businesses at 68% and subscription businesses at 59%. What matters is that you measure your own ratio, not that you assume the canonical figure applies. (Full citations in the Further Reading section.)
Misunderstanding 2: The bottom 80% is worthless. Juran explicitly corrected this by changing ‘trivial many’ to ‘useful many.’ The bottom tier often provides revenue stability, fixed-cost coverage, and the data volume that reveals patterns. Not worth the same investment per unit, but that’s different from valueless.
Misunderstanding 3: This is a one-time insight. Operators run a Pareto audit once, act on it, and consider the job done. But the distribution changes. New customers enter, offers evolve, channels shift. A quarterly or annual cadence keeps the analysis current.
Misunderstanding 4: It only applies to revenue. The pareto principle is just as useful applied to time, operational problems, content performance, and churn drivers as it is to revenue. Operators who only run it on the money side miss half the leverage.
Misunderstanding 5: High concentration is always a good sign. It’s also a fragility signal. If your top three customers represent 75% of revenue and one leaves, you have a serious problem. Pareto concentration should trigger both a ‘focus here’ conversation and a ‘think about diversifying’ conversation at the same time.
Common Mistakes
- Auditing revenue but skipping margin, then protecting the wrong customers. Before deciding which customers are ‘top tier,’ load the full cost to serve, support hours, custom accommodations, billing complexity, volume discounts. A customer at 15% of revenue who consumes 40% of service capacity may be net-negative. Sort by margin contribution, not just gross revenue, and make decisions from that column.
- Building a top-tier designation with no tangible difference in experience. If your top-20% customers get the same response times, the same access to capacity, and the same notice of new offers as everyone else, the designation is a label, not a strategy. Attach at least one concrete SLA difference, a faster response window, a direct escalation path, or early access to new services, so the tier means something to the customer and reduces churn risk where it matters most.
- Applying the pareto principle to a channel that has been live for fewer than six months. A new channel will almost always look weak in a Pareto audit because early data skews toward awareness-stage activity rather than closed revenue. Set a minimum data window, at minimum twelve months of lead-to-close history, before using a Pareto audit to decide whether a channel deserves continued investment. Cutting a channel at month four because it isn’t in the top 20% conflates immaturity with underperformance.
- Profiling the vital few by revenue tier but never testing whether new prospects actually match the profile. The whole point of characterizing your top-20% customer is to use that profile at the front of the funnel. Build two or three qualifying questions based on the profile into your discovery call or intake form, and track close rates and twelve-month margin by how well a prospect matched the profile at intake. That feedback loop is what makes the audit compound over time.
- Running a customer revenue audit but skipping the problem frequency audit entirely. Pull support tickets, churn exit surveys, and refund requests for the last six months. Categorize and count. You’ll likely find two or three recurring failure modes generating the majority of customer friction. Fix those before layering on retention campaigns. Campaigns don’t patch structural problems, and this audit is at least as valuable as the revenue sort, often more so.
Operator’s Take
Running the audit is the easy part. Deciding what to do with what you find, and having the nerve to act on it, is where most operators stall.
So here’s what I’d actually do with the numbers, in a specific order.
First, build a formal top-tier program. Not a vague ‘we treat our best clients well’ sentiment, a structured offer with at least one concrete, visible difference. Quarterly business reviews for the top 20% by margin. A direct escalation path when something goes wrong. First access to new capacity or new services before you open them up broadly. Even a simple SLA difference, say a 24-hour response commitment for the top tier versus 72 hours for everyone else, signals to those customers that you see them. That signal reduces churn among exactly the people you can least afford to lose. AI tools can help flag when top-tier accounts go quiet or when usage patterns shift before a customer tells you there’s a problem. What you do with that signal is still your call.
Second, write an ideal customer profile that’s specific enough to use in the field. Not ‘mid-size B2B companies in the Southwest’, something a salesperson can use to qualify a prospect in the first five minutes. Industry, company size, the internal trigger that created urgency, how they typically describe their problem, what offer they started with. If you can describe your top 20% that precisely, you can start filtering your pipeline earlier and stop spending sales time on people who are going to land in the bottom tier regardless of how well the pitch goes.
Third, price the bottom tier honestly. If you fully load the service cost on your bottom-revenue customers, support hours, billing complexity, custom accommodations, the mental overhead of their edge cases, some of them are probably unprofitable. The fix isn’t always to fire them. Sometimes it’s to reprice them to reflect the actual cost to serve, or to migrate them to a self-service tier where they’re profitable at lower touch. That reprice conversation feels hard. It’s considerably less hard than the slow drain of subsidizing customers who shouldn’t be at your current price point.
Fourth, run a problem frequency audit separately from the revenue audit. Take your last six months of support tickets, churn exit surveys, and refund requests. Categorize the reasons. Count them. You’ll almost certainly find two or three failure modes generating the majority of the friction, and fixing them will do more for retention than any loyalty program you could layer on top. This is Juran’s original application, and almost no small operator does it. The revenue audit tells you who’s valuable. The problem audit tells you why they leave. You need both.
One practical note: none of this requires complex analytics. A sorted spreadsheet is enough to start. The operators who get the most out of 80/20 thinking aren’t the ones with the best data infrastructure, they’re the ones who look at the output and do something different the following week.
Used in
- ✓ Build a Complete Marketing Department
Used to prioritize which customer segments, offers, and acquisition channels deserve the majority of marketing investment rather than treating every input equally. - ✓ The Missing Manual for FunnelKit
Used to identify which funnel stages and offers produce the most conversions so automation resources concentrate where the leverage actually is. - ✓ The Missing Manual for Make
Used to prioritize which operational bottlenecks and recurring error types to automate first, following the Juran logic of fixing the vital few root causes.
FAQ
Does the pareto principle always mean exactly 80% comes from 20%?
No. The 80/20 figures are shorthand for a general observation about unequal distributions. Kim, Singh, and Winer’s 2017 study in Marketing Letters, covering 22 CPG categories and six years of purchase data, found the mean Pareto ratio at the brand level was 0.73, meaning 73% of sales came from the top 20% of customers, not 80%. McCarthy and Winer’s 2019 follow-up in the same journal, using 339 publicly traded non-CPG companies, found an overall average of 67%, with non-subscription businesses at 68% and subscription businesses at 59%. The concentration is real and consistent across industries; the 80 figure is a ceiling most businesses don’t hit. Run your own numbers and act on what you find.
Should I cut the bottom 80% of my customers?
Not automatically. First load the full service cost to find who is genuinely unprofitable, the bottom tier by revenue isn’t always the bottom tier by margin. Second, check whether any are early-stage relationships with growth potential. Then make deliberate decisions rather than cutting by formula. Juran’s later framing called this group the ‘useful many’ precisely to head off that mistake.
How often should I run a Pareto audit on my business?
At minimum annually, and after any major change in your customer mix, offer menu, or acquisition channels. Quarterly is better for fast-moving businesses. The distribution shifts as the business changes, and a stale audit leads to stale strategy.
Is there a downside to having high Pareto concentration in my top customers?
Yes. If a handful of customers represent the overwhelming majority of your revenue, losing one becomes a serious business event. Pareto focus and diversification aren’t opposites, mature strategy holds both simultaneously.
Who actually named the Pareto Principle, and what does 1951 refer to?
Joseph M. Juran coined the term and named it after Vilfredo Pareto, whose 1896 to 97 work on wealth distribution inspired him. But the generalization of that observation into a universal management principle was Juran’s own contribution, a point Juran made explicitly in his May 1975 Quality Progress article ‘The Non-Pareto Principle; Mea Culpa’ (Vol. 8, No. 5, pp. 8 to 9). The 1951 date refers to his Quality Control Handbook (McGraw-Hill), the first edition of the book where he introduced the principle as a management tool. Pareto’s underlying observation predates that by more than fifty years.
Can I apply the pareto principle to things other than customer revenue?
Yes, it applies to product lines, acquisition channels, support ticket categories, content page traffic, churn reasons, and more. Operators who only run it on revenue miss some of the most actionable versions of the analysis, including the original application Juran intended: identifying the small number of defect or problem types causing most of the operational damage.
Further reading
- Joseph M. Juran, Quality Control Handbook (1st ed. McGraw-Hill, 1951)The source that named the principle and established its use as a management tool; the manufacturing framing transfers directly to operational triage in any small business.
- Joseph M. Juran, ‘The Non-Pareto Principle; Mea Culpa,’ Quality ProgressVol. 8, No. 5, May 1975, pp. 8 to 9Juran’s own correction of the attribution, and the piece where he shifted ‘trivial many’ to ‘useful many.’ Short and worth reading for the historical record. Available via the American Society for Quality (ASQ) archive.
- Baek Jung Kim, Vishal Singh, and Russell S. Winer, ‘The Pareto Rule for Frequently Purchased Packaged Goods: An Empirical Generalization,’ Marketing LettersVol. 28, No. 4, December 2017, pp. 491 to 507The most rigorous empirical test of the 80/20 claim in CPG marketing, using six years of panel data across 22 categories; found the actual mean ratio at the brand level is 0.73.
- Daniel M. McCarthy and Russell S. Winer, ‘The Pareto Rule in Marketing Revisited: Is It 80/20 or 70/20?’ Marketing LettersVol. 30, No. 2, June 2019, pp. 139 to 150Extends the Kim et al. analysis to 339 publicly traded non-CPG companies and finds an overall average of 67%; useful for operators in service and non-packaged-goods categories.
- Richard Koch, The 80/20 Principle (Nicholas Brealey Publishing, 1997)The book that brought the idea to a broad business audience and extended it across strategy, time management, and personal productivity; worth reading for breadth of application even if the self-help overlay wears thin.
Sources:
History and attribution of the Pareto Principle grounded in: Juran Institute biography of Joseph Juran (juran.com, accessed October 2026); American Society for Quality archive listing for Juran, J.M. ‘The Non-Pareto Principle; Mea Culpa,’ Quality ProgressVol. 8, Issue 5, May 1975, pp. 8 to 9 (asq.org, accessed October 2026); ProjectWizards overview citing Juran’s Quality Control Handbook (1st ed. McGraw-Hill, 1951) and the same 1975 article (projectwizards.net, accessed October 2026); Wikipedia entries on Vilfredo Pareto, Joseph M. Juran, and the Pareto principle. Pareto’s original observations dated to his Cours d’économie politique (Lausanne: F. Rouge, 1896 to 97). Juran’s shift from ‘trivial many’ to ‘useful many,’ and the characterization of his intent, drawn from the Wikipedia entry on Joseph M. Juran and the Juran Institute biography. The distinction between Pareto’s original observation (a specific power-law distribution of wealth) and Juran’s generalization (a universal management principle) is grounded in Juran’s own 1975 article, where he conceded the generalization was his contribution, not Pareto’s.
Empirical research on real-world Pareto ratios: Kim, Baek Jung, Vishal Singh, and Russell S. Winer, ‘The Pareto Rule for Frequently Purchased Packaged Goods: An Empirical Generalization,’ Marketing LettersVol. 28, No. 4, December 2017, pp. 491 to 507 (mean Pareto ratio 0.73 at brand level across 22 CPG categories, six-year panel); McCarthy, Daniel M. and Russell S. Winer, ‘The Pareto Rule in Marketing Revisited: Is It 80/20 or 70/20?’ Marketing LettersVol. 30, No. 2, June 2019, pp. 139 to 150 (overall average 0.67 across 339 publicly traded non-CPG companies; non-subscription 0.68, subscription 0.59). Both papers published by Springer in Marketing Letters and verified via Springer’s journal pages (link.springer.com).
Richard Koch’s role in popularization sourced from publisher records for The 80/20 Principle (Nicholas Brealey Publishing, 1997). The note that 1951 refers to Juran’s publication, not Pareto’s 1896 to 97 observations, is the editors’ own clarification based on primary source review. All Pareto ratio figures reported to the precision used in the cited studies (two decimal places expressed as a percentage).
Brian Kasday spent forty years in direct-response marketing before rebuilding the whole operation as a one-person shop. He writes The Operator’s Library — including “Build a Complete Marketing Department” — for operators who’d rather build it themselves than wait on someone else.
Build the department these ideas describe. The free companion kit: mmsvegas.com/resources.
More The Operator's Canon guides
Free · Operator Toolkit
Want the tools, not just the guide?
Get the free operator toolkit — templates and checklists for the systems you actually run, plus a note when this guide changes.
Get the free toolkit →