
Last updated: August 2026
The service profit chain is the causal argument that the way you run your internal operations, how you hire, support, equip, and empower your people, determines the quality of service your customers receive, which determines how long those customers stay, which determines your profit. By the end of this page, you’ll be able to map the weak link in your own chain, identify whether your retention problem is actually an employee-systems problem in disguise, and build a measurement practice that traces customer loyalty back to its operational root.
Most operators treat customer retention and employee management as two separate problems handled in two different meetings. The service profit chain says that’s the wrong frame entirely. They’re the same problem, viewed from opposite ends. When a customer churns because the service felt impersonal or inconsistent, there’s almost always an upstream cause: a frontline employee who wasn’t trained, wasn’t empowered, wasn’t supported, or didn’t stick around long enough to get good. Fix the employee system and the customer retention number tends to follow. Skip the employee system and no loyalty program in the world closes the gap.
That’s the argument. It’s three decades old and it still describes something most small businesses get badly wrong.
The idea in 30 seconds
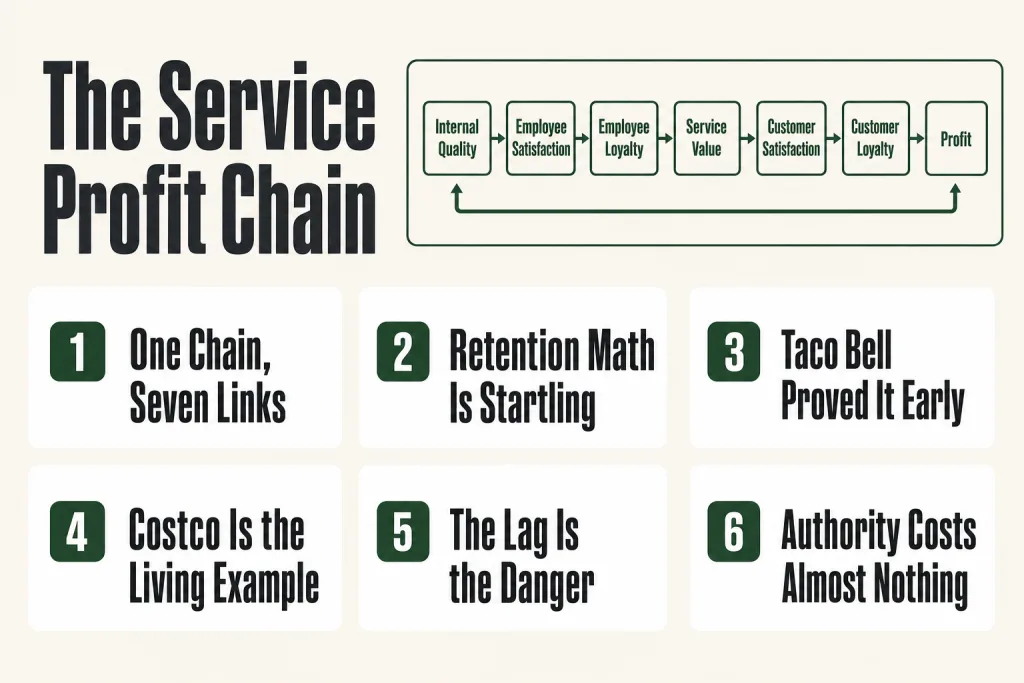
- The service profit chain is a cause-and-effect model: internal employee systems → employee satisfaction → employee loyalty → service quality → customer satisfaction → customer loyalty → profit and growth.
- It was introduced by Heskett, Jones, Loveman, Sasser, and Schlesinger in a 1994 Harvard Business Review article and later expanded into a 1997 book, authored by three of the five original contributors: Heskett, Sasser, and Schlesinger.
- The chain runs in both directions, a breakdown anywhere (undertrained staff, ambiguous processes, unsupported frontline workers) propagates forward to customer churn and backward to margin erosion.
- For a small-business operator, the most actionable insight is this: fix the internal systems that make employees’ jobs hard before you run another retention campaign.
- Costco’s roughly 6% annual turnover for employees with more than one year of tenure, against a 60 to 70% retail-industry average, and its U.S. membership renewal rate of approximately 92% at the close of fiscal 2025 is one of the clearest modern data points supporting the chain’s logic at scale.
- The chain does not mean “make employees happy at any cost”; it means deliberately designing the internal environment so capable people can do excellent work for customers.
Where the Service Profit Chain Came From
The service profit chain arrived in a 1994 Harvard Business Review article, “Putting the Service-Profit Chain to Work”, by James Heskett, Thomas Jones, Gary Loveman, Earl Sasser, and Leonard Schlesinger. Three years later, Heskett, Sasser, and Schlesinger published the book-length treatment: The Service Profit Chain: How Leading Companies Link Profit and Growth to Loyalty, Satisfaction and Value (Free Press, 1997).
The early 1990s were dominated by management-by-numbers thinking, profit targets and shareholder returns above all else. The HBR article pushed back directly: the authors argued that outstanding service executives kept frontline workers and customers at the center of their attention, and the financial results followed from that, not the other way around.
One of the data points that grounded the original argument came from Taco Bell’s internal store analysis, comparing its lowest-turnover locations to its highest. The 20% of stores with the lowest workforce turnover had double the sales and 55% higher profits than the 20% with the highest turnover. The fix wasn’t a customer campaign; it was internal, giving employees more latitude for on-the-job decision-making. Southwest Airlines appeared as another early exemplar. The 1994 article did most of the analytical heavy lifting that the book later expanded on, just in considerably fewer pages.
The Service Profit Chain: How Each Link Works
The model is built on seven interconnected links, each feeding the next through cause and effect: internal service quality, employee satisfaction, employee loyalty and productivity, external service value, customer satisfaction, customer loyalty, and profit and revenue growth.
Here’s how they actually work in a small-business context, because the academic framing can obscure the practical mechanics.
Link 1, Internal Service Quality
Internal service quality is everything the employee experiences before they ever face a customer: clear job expectations, functional tools, the authority to make reasonable decisions, solid training, and a manager who doesn’t create new problems every shift. In a ten-person business, this is mostly about systems and attitude. Do your people have what they need to do the job well? Or are they improvising around broken processes and unclear authority every day?
Link 2, Employee Satisfaction
Satisfaction follows from competence and meaningful work. Pay matters, but it’s one input among several. An employee who knows their job, has what they need to do it, and can see that their work actually matters, that person is satisfied in a way that shows up in how they treat customers. An employee who’s confused, under-resourced, and constantly escalating to a manager is not, regardless of their paycheck.
Link 3, Employee Loyalty and Productivity
Loyalty here means tenure, people who stay. And tenure has a hard financial logic: a technician in their third year costs less to keep and delivers more to customers than one in their third week. Recruitment, onboarding, and the inevitable quality dip that comes with inexperience aren’t line items most operators track carefully enough.
Link 4, External Service Value
This is where the chain crosses from internal to external. Value a customer perceives isn’t just about price or features, it’s about the competence and consistency of the people serving them. An experienced employee who knows your products, knows your processes, and has the authority to solve problems delivers genuinely different service than one still finding their footing.
Links 5, 6, and 7, Customer Satisfaction, Customer Loyalty, Profit
This is where the chain connects to metrics operators actually track. Reichheld and Sasser’s research, cited in the original HBR article, found that a 5% increase in customer loyalty can produce profit increases from 25% to 85%. That range is wide because leverage varies by business model, subscription businesses and professional services skew toward the high end.
All of these links depend on one another. You can’t bolt a loyalty program onto a broken internal environment and expect the chain to hold.
Why the Service Profit Chain Still Holds
The model is thirty years old. Does the logic still apply when AI handles more customer interactions, remote work has changed the employee experience, and digital products have inserted a layer of technology between staff and customers?
It does, with some translation.
The underlying dynamic hasn’t changed: employees who feel supported and equipped convey that through the quality of their work, and customers feel it. In SaaS, this plays out through customer success reps who actually know the product and stay long enough to learn a customer’s context. In professional services, it’s the consultant whose institutional knowledge is genuinely irreplaceable. In retail and hospitality, it’s the staff member who remembers faces and preferences. The medium changes; the dynamic doesn’t.
What has intensified is the cost of the chain breaking. The retail industry’s annual employee turnover rate averages approximately 60 to 70%, meaning the average retailer replaces most of its workforce every year, generating continuous cost for recruiting, onboarding, training, and the quality reduction that comes from a perpetually inexperienced team. For a small business running ten people, two or three departures in a year can eat the equivalent of a marketing budget. The damage isn’t only direct, high turnover strains managers, degrades culture, and weakens your brand’s relationship with long-term customers who notice when their favorite faces disappear.
The feedback loop also runs in the positive direction. Long-tenured customers who know your processes, forgive occasional failures, and don’t need hand-holding make employees’ days better. That satisfaction feeds right back into retention. A virtuous cycle once you get it going, and a vicious one when it’s running the other way.
One thing the original model undersold: the role of employee autonomy. Empowering employees with genuine decision-making authority, allowing them to resolve problems without escalating every unusual situation to a manager, isn’t just faster for the customer. It’s more satisfying for the employee. Authority to act is part of the internal service quality calculus, and in most small-business contexts, it costs almost nothing to grant.
Putting this to work? The ideas in the Canon are the foundation under the tactical playbook in Build a Complete Marketing Department — grab the free companion kit at mmsvegas.com/resources.
Modern Examples That Show the Service Profit Chain in Action
You don’t have to take a 1994 HBR article on faith. There are more recent data points, though they come with caveats worth naming upfront. Correlation runs through all of them, and hindsight makes clean narratives out of complicated operations. Keep that in mind as you read.
Costco
Costco is the most-cited living example of the chain at enterprise scale, and the numbers are hard to wave away. Its one-year employee retention rate runs at 93%, and for employees who cross the one-year mark, annual turnover drops to around 6%, against a retail-industry average of 60 to 70%. The company pays entry-level positions well above the national retail median, locks in wage increases through multiyear labor agreements, and promotes the vast majority of warehouse managers from hourly roles. That’s the internal service quality model made explicit policy.
The customer side holds up: Costco posted a U.S. membership renewal rate of approximately 92% at the close of fiscal 2025. Members are paying to stay, year after year. The pattern is visible on the floor, employees who’ve been there long enough to recognize regular members, know the layout cold, and act like they have a stake in the outcome.
What you can’t prove cleanly from the outside is the direction of causation. Costco also has exceptional buying power, a strong private label, and a membership model that creates switching costs. The employee-retention story fits neatly with the chain’s logic, but Costco’s retention numbers almost certainly reflect multiple mutually reinforcing factors. The chain is probably one of them, possibly the most important one. Probably not the only one.
Southwest Airlines
Southwest built its early reputation on an explicit employee-first philosophy. The idea was that employees who feel valued deliver service that converts commodity air travel into something customers choose on purpose, even when competitors undercut on price.
The December 2022 holiday meltdown tested that thesis from the other direction. Southwest canceled approximately 16,900 flights over about a week, stranding more than 2 million passengers. Weather triggered the crisis, but weather wasn’t what made it catastrophic. The root problem was an aging crew-scheduling system, legacy mainframe software that couldn’t handle the scale of disruption when a winter storm hit. Pilots and crew were stranded at airports, unable to reach schedulers, with hold times reportedly exceeding five hours. That’s a textbook internal service quality failure: the tools employees needed to do their jobs didn’t exist, and the cascading effect was a customer disaster.
The meltdown cost the airline more than $1.1 billion in refunds, reimbursements, and lost ticket sales. Customers bore the downstream cost of an upstream systems failure, exactly the sequence the chain predicts.
By 2024, after fixing the internal environment, Southwest ranked first in economy-class customer satisfaction in the J.D. Power North America Airline Satisfaction Study for the fourth consecutive year, also rating No. 1 in airline staff and level of trust. The recovery is consistent with the chain’s logic. But call it what it is: consistent with, not proof of. Southwest also operates in a market with loyal customers, a strong brand, and route network advantages that help any recovery narrative. The chain explains part of what happened in 2022 and part of what happened after. It doesn’t explain everything.
What the Southwest example does illustrate cleanly is the lag. By the time customers were stranded and furious, the upstream systems failure was years in the making. That delay, between internal systems degrading and customer outcomes deteriorating, is the feature of the chain most operators underestimate.
Nordstrom and John Lewis
Both operate in commoditized retail categories where price is the obvious differentiator. Neither wins primarily on price. They win on service consistency, which traces directly to how they hire, pay, train, and empower their people. The interesting thing isn’t that they’re exceptional; it’s that service quality holds a price premium even where you’d expect it to get competed away.
Applying the Service Profit Chain as a Small-Business Operator
The chain was studied at Taco Bell, Southwest, and Intuit. The logic scales all the way down to a ten-person HVAC company or a boutique accounting firm. Here’s how to actually use it.
Step 1: Audit Your Internal Service Quality First
Before you run an employee satisfaction survey, walk through what it’s actually like to do your employees’ jobs. Where do they hit friction? What decisions need manager approval that probably shouldn’t? What information are they missing when a customer asks a hard question? What tool or process makes them look bad in front of customers?
Make a list. That list is your chain’s weakest link. Fix it before anything else. The chain starts here, not at the customer-facing end.
Step 2: Measure Employee Satisfaction and Tenure Separately
Employee satisfaction tells you about the present; tenure tells you about the investment you’ve retained. An employee can be satisfied and still leave because they don’t see a path forward. Track both. Employee NPS, would you recommend working here to a friend? is a blunt but useful instrument for a small business. You want to know if the number is moving and why. That requires a follow-up conversation, not just a score.
Step 3: Map Employee Tenure Against Customer Satisfaction
This is the diagnostic move that makes the chain visible. Pull your customer satisfaction data, NPS, CSAT, review scores, renewal rates, and cross-reference it with average employee tenure on the accounts or interactions involved. You don’t need a statistician. You need to notice whether your long-tenured employees consistently produce better customer outcomes than recent hires. Almost always, they do. That’s the financial case for retention investment, made visible in your own numbers.
Step 4: Connect the Chain to Your CLV Math
The chain ultimately lands in your customer lifetime value numbers. Work backwards: if your average customer stays 18 months and your retention rate is 70%, what does it cost you versus 90%? Run the math on extended tenure, the compounding effect is often startling. Now ask: what would it cost in internal service quality investment, better tools, better pay, better training, more autonomy, to move employee retention, and through it, customer retention? That’s the business case. In most small businesses, the numbers make themselves.
Step 5: Design Feedback Loops Across the Chain
The most operationally sophisticated thing you can do is close the information loop so customer data informs employee management decisions, and employee data informs customer strategy. Customer-facing feedback, reviews, renewal conversations, exit interviews when someone churns, needs to reach the people managing employee systems, not stay siloed in marketing or customer success. In practice for a small business, that means one cross-functional meeting where both sets of numbers are on the same agenda.
Where the Chain Applies Most Directly
The service profit chain runs hottest in businesses where employees have significant access to customers, professional services, agencies, healthcare, hospitality, home services, financial services, high-touch SaaS. If your customers primarily interact with software, the chain still applies, but the human links are compacted into fewer touchpoints, so each one carries more weight, not less.
Where the Service Profit Chain Breaks Down
The model has real limits. Honest operators should know them.
It assumes the customer experience is primarily human-delivered. In a fully automated or product-led business where customers almost never speak to a person, the employee satisfaction link is real but its leverage is concentrated in product and engineering teams, not frontline staff. The chain still matters, undertooled engineers ship worse products, but the seven-link model doesn’t map cleanly onto it.
It can justify poor business decisions. The model is sometimes used to argue that any investment in employees automatically pays off. That’s not true. The same logic that says loyal customers drive profit also requires you to assess which customers are worth retaining. Striving to keep unprofitable customers loyal isn’t a viable model, and the same selectivity applies to employees and roles. Investing in the wrong people or structure doesn’t save a broken business, regardless of how satisfied they are.
The time lag creates accountability problems. Because the chain moves slowly, employee-side changes take months to show up in customer metrics, operators in financial distress may not have the runway to let it work. If you’re twelve months from insolvency, redesigning your internal service quality is the right long-term move and the wrong short-term one.
Satisfaction doesn’t equal performance. A satisfied employee is not necessarily a high-performing one. The chain requires both. Supportive systems tend to release discretionary effort, that’s often true, but not universally. Culture and accountability still matter alongside satisfaction.
Not all customer loyalty is chain-driven. Customers also stay because of switching costs, contracts, habit, or lack of alternatives, none of which trace back to your employee systems. The service profit chain explains loyalty earned through service quality. It doesn’t explain all loyalty. Operators who conflate the two miss where they’re actually retaining customers versus where they’re just fortunate.
What People Get Wrong About the Service Profit Chain
Misunderstanding 1: It’s about making employees happy. The chain is not a mandate to maximize employee happiness. It’s a design argument for internal service quality, the systems, clarity, tools, and authority that enable people to do excellent work. An employee can be very happy in a role that produces mediocre service for customers, if the internal environment rewards showing up without requiring real competence. That’s not what the chain describes.
Misunderstanding 2: It starts with pay. Pay is one input into internal service quality, but it’s not the lead variable. Many operators raise wages and see no improvement in retention or service quality because the underlying systems, unclear roles, poor training, no autonomy, remain unchanged. Wages without the rest of the internal-quality package don’t move the chain.
Misunderstanding 3: The chain only runs one way. It runs in both directions. Happy, long-tenure customers are easier to serve. They know your processes, require less hand-holding, forgive occasional failures more readily, and make employees’ days better. This bidirectional reinforcement is why the virtuous cycle, once established, is hard to break, and why the vicious cycle is similarly self-reinforcing once it gets going.
Misunderstanding 4: Customer loyalty programs are the chain. Loyalty programs, points, discounts, tiers, can capture a retention effect, but they’re not the chain. They’re a downstream intervention that doesn’t address the upstream causes of churn. If customers are leaving because service is inconsistent or impersonal, a points program delays the exit; it doesn’t fix the reason for it. Durable loyalty comes from the experience, not the incentive structure layered on top of it.
Misunderstanding 5: It’s only relevant for large service companies. The links are more visible and more direct in a small business, where one departing employee can move customer satisfaction metrics measurably. If anything, the stakes per employee are higher at smaller scale, which makes the chain more urgent to understand, not less.
Common Mistakes
- Raising wages and then waiting for the chain to move — A pay increase announced in January that produces no change in retention by April isn’t proof the chain doesn’t work, it’s proof wages were never the binding constraint. The pattern looks like this: operator raises entry-level pay by $3/hour, exit interviews still cite confusion about role expectations and no clear path to advancement, and turnover barely moves. The audit has to happen before the pay review, not after. Talk to two or three current employees about what makes their job harder than it should be. The answers are almost never about the hourly rate.
- Handing the chain to HR and calling it managed — When the service profit chain lives in the HR department, tracked as engagement scores and summarized in exit interview reports that reach no one with operational authority, it never changes anything. The link between internal service quality and customer profit is a financial and operational decision. The operator has to own it. In practice, that means the person who sets tool budgets, process design, and role clarity is reading the same employee feedback data as the person tracking renewal rates, and both numbers are in the same monthly review.
- Watching customer metrics and ignoring what’s upstream — Tracking NPS and renewal rates without tracking employee tenure trends, role clarity, or first-contact resolution rates is like watching the exhaust pipe and ignoring the engine. By the time the customer number moves, the cause is already months old. One practical fix: add average employee tenure by team or account to whatever dashboard your customer satisfaction numbers live on. When tenure drops in a quarter where service scores are still fine, you’re looking at a leading indicator. Act on it then, not six months later when the churn shows up.
- Cutting headcount without running the CLV math first — In a cost-cutting moment, reducing headcount looks clean on a spreadsheet. It rarely accounts for what happens downstream: accounts that churn because service quality degraded, institutional knowledge that walked out with the person, managers stretched thin covering gaps. Before any cut, run the customer lifetime value math on the accounts that employee touches. How much customer revenue is at risk if average tenure drops on that team? In service businesses with high-touch relationships, the answer is often larger than the payroll saving, and that needs to be in the decision, not discovered afterward.
- Abandoning an internal systems change after six weeks with no visible result — Operators redesign onboarding, expand employee decision-making authority, or fix a broken process, and when NPS hasn’t moved six weeks later, they conclude the investment didn’t work and move on. The chain moves slowly by design. Employee-side improvements show up in customer metrics on a 3 to 6 month lag, sometimes longer for complex service relationships. The right response to the lag isn’t abandonment, it’s tracking intermediate signals. Employee NPS, tenure trends, and first-contact resolution rates will move before headline retention numbers do. Track those during the lag so you’re not flying blind.
Operator’s Take
When a customer churns, the instinct is to ask what went wrong on the customer side, pricing, a bad renewal conversation, a competitor undercutting you. The chain demands a prior question: what was the employee-side condition that produced that service failure in the sixty days before they left? Nine times out of ten, the answer involves someone who was undertrained, hadn’t been in the role long enough to get good, or didn’t have the authority to fix the problem when it first appeared.
So here’s what to actually do with that. Pull your last five customer churns and trace each one backwards, not to the renewal conversation, but further back. What was the service interaction quality in the sixty days prior? Who was delivering it, and how long had they been on your team? Write it down. That pattern tells you where the chain broke, and it almost never implicates a customer-facing intervention as the fix.
While you’re at it, do an authority audit. Map every situation your frontline people escalate to you or a manager. For each one, ask honestly: should they be able to handle this themselves? Most small businesses have employees escalating things they should be empowered to resolve, a refund under $50, a scheduling exception, a service recovery that needs a quick apology and a fix. Every unnecessary escalation is a tax on the customer experience and a quiet signal to the employee that you don’t trust their judgment. Granting that authority costs almost nothing. Withholding it costs you in ways that don’t show up on any invoice.
The second shift is in how you justify investment. Most operators make employee investment arguments in the language of “this is the right thing to do”, which loses every time there’s a budget crunch. The chain gives you a different language: here’s how employee tenure correlates with customer renewal rates in our own data, here’s the CLV math on a 10% retention improvement, here’s what it costs us in downstream churn when an experienced employee walks out. That argument wins budget conversations. The moral one doesn’t, not reliably.
One specific number to add to your dashboard: average employee tenure by team or account. Not overall headcount, not aggregate satisfaction scores, tenure, by team. When that number drops in a quarter where service scores are still holding fine, you’re looking at a leading indicator. Act on it then. The churn will show up six months later if you don’t.
If you’re running AI tools for customer feedback analysis or account health scoring, and you probably should be, use them here. The signal these tools are genuinely good at catching is drift: accounts where sentiment is quietly declining, service patterns that differ between your tenured staff and recent hires, resolution rates that flag a process gap before it becomes a visible complaint. That’s earlier signal than any customer survey will give you. The judgment about what to do with it, the conversation with the employee, the decision to redesign a role, the call to a wavering customer, that stays with you. AI cuts your dependence on waiting for the lagging indicators. It doesn’t make the calls.
Where to stay skeptical: the chain is a diagnostic tool, not a theory of everything. Switching costs, contract terms, product-market fit, and pricing power all affect retention independent of your employee systems. Use the chain to find where you’re bleeding upstream, not as justification for keeping a role or person who simply isn’t working.
Used in
- ✓ Build a Complete Marketing Department
Used to frame customer retention as an operational and employee-systems problem, not just a marketing one, connecting internal service quality investments to the revenue metrics a marketing department is held to. - ✓ The Missing Manual for FunnelKit
Applied when designing post-purchase automation sequences that reflect the service quality the chain requires, ensuring that the automated experience after the sale matches the expectations set by the human-delivered service. - ✓ The Missing Manual for Make
Informs which internal workflows to automate first, prioritizing the backstage processes that reduce friction for frontline employees, so automation serves internal service quality rather than bypassing it.
FAQ
Is the service profit chain only relevant for large companies?
No, the logic applies to any size business where employees interact with customers. In smaller businesses, the links are often more direct and visible. One departing employee can move your customer satisfaction scores measurably, which means the stakes per person are actually higher at small scale.
How do I measure the service profit chain in a small business without a data science team?
Start with three numbers tracked together: average employee tenure, employee NPS (would you recommend working here to a friend?), and customer renewal or retention rate. Review all three in the same monthly conversation and look for movement patterns. The diagnostic insight comes from watching them move relative to each other, not from having precise measurement of each link.
What’s the difference between the service profit chain and an employee engagement program?
An employee engagement program is typically an HR initiative focused on satisfaction scores. The service profit chain is a causal business model that traces a specific path from internal operations through employee behavior to customer outcomes and financial results. The chain requires you to connect those measurements, not just improve one in isolation.
Does the service profit chain apply to SaaS and digital businesses?
Yes, though the chain is more compressed. In high-touch SaaS, customer success managers, implementation staff, and support teams carry the human links. In product-led businesses with minimal human contact, the chain still applies but the internal-quality link runs through the product and engineering team experience rather than frontline staff, undertooled engineers ship worse products.
If I improve employee satisfaction, how long before I see it in customer metrics?
Expect a 3 to 6 month lag at minimum, sometimes longer for complex service relationships. Intermediate signals, employee tenure trends, resolution rates, customer feedback on specific service interactions, will move before headline retention numbers do. Track those intermediates so you’re not flying blind during the lag.
Does the service profit chain mean I should never cut staff costs?
No. It means you should understand what staff cuts cost in downstream customer retention terms before you make them. Sometimes the financial math still supports a reduction; sometimes it doesn’t. The chain gives you the analytical frame to make that decision with the full cost picture, not just the immediate payroll saving.
Further reading
- “Putting the Service-Profit Chain to Work”Heskett, Jones, Loveman, Sasser & Schlesinger, Harvard Business ReviewMarch, April 1994. The original article; still readable and specific, with the Taco Bell and USAA data that grounded the model.
- The Service Profit Chain: How Leading Companies Link Profit and Growth to Loyalty, Satisfaction, and ValueHeskett, Sasser & Schlesinger (Free Press, 1997). The book-length treatment, authored by three of the five original contributors, extending the model with additional case research.
- The Loyalty EffectFrederick Reichheld (1996). Extends the chain’s customer-side logic with the financial math of loyalty economics; pairs well with the Heskett et al. framework for operators who want to build the retention business case.
Sources: Heskett, Jones, Loveman, Sasser & Schlesinger, “Putting the Service-Profit Chain to Work,” Harvard Business ReviewVol. 72, No. 2, March, April 1994, pp. 164 to 174 (Harvard Business School faculty page, hbs.edu). Heskett, Sasser & Schlesinger, The Service Profit ChainFree Press, 1997. Harvard Business School Online, “Explaining the Service-Profit Chain,” online.hbs.edu, March 2025. B2B Frameworks, “Service Profit Chain,” b2bframeworks.com. Costco Wholesale Corporation, Form 10-K for the fiscal year ended August 31, 2025, and the Q4 fiscal 2025 earnings disclosure, for the membership renewal rate (92.3% U.S. and Canada at the close of fiscal 2025; the lower worldwide figure of 89.8% is a different measure and is not the one quoted here). Costco employee turnover figures are widely reported but the company does not disclose them, so treat the turnover comparison as directional. The Spokesman-Review, “Costco tested members with higher fees,” spokesman.com, October 2025. Southwest Airlines Investor Relations press release, “Southwest Airlines Ranks First in Economy Class Customer Satisfaction by J.D. Power for Fourth Year in a Row,” southwestairlinesinvestorrelations.com, May 2025. Customer Experience Dive, “Southwest misses 2023 customer satisfaction target,” customerexperiencedive.com, April 2024. Restaurant Business Online, “Taco Bell is making investments in its workforce,” restaurantbusinessonline.com, October 2025.
Brian Kasday spent forty years in direct-response marketing before rebuilding the whole operation as a one-person shop. He writes The Operator’s Library — including “Build a Complete Marketing Department” — for operators who’d rather build it themselves than wait on someone else.
Build the department these ideas describe — the free companion kit: mmsvegas.com/resources.
More The Operator's Canon guides
Free · Operator Toolkit
Want the tools, not just the guide?
Get the free operator toolkit — templates and checklists for the systems you actually run, plus a note when this guide changes.
Get the free toolkit →How to cite: Service Profit Chain. Associated with Heskett, Jones, Loveman, Sasser & Schlesinger, 1994. The Operator’s Canon, MMS Vegas. https://mmsvegas.com/library/service-profit-chain-explained/