
The 30-second answer
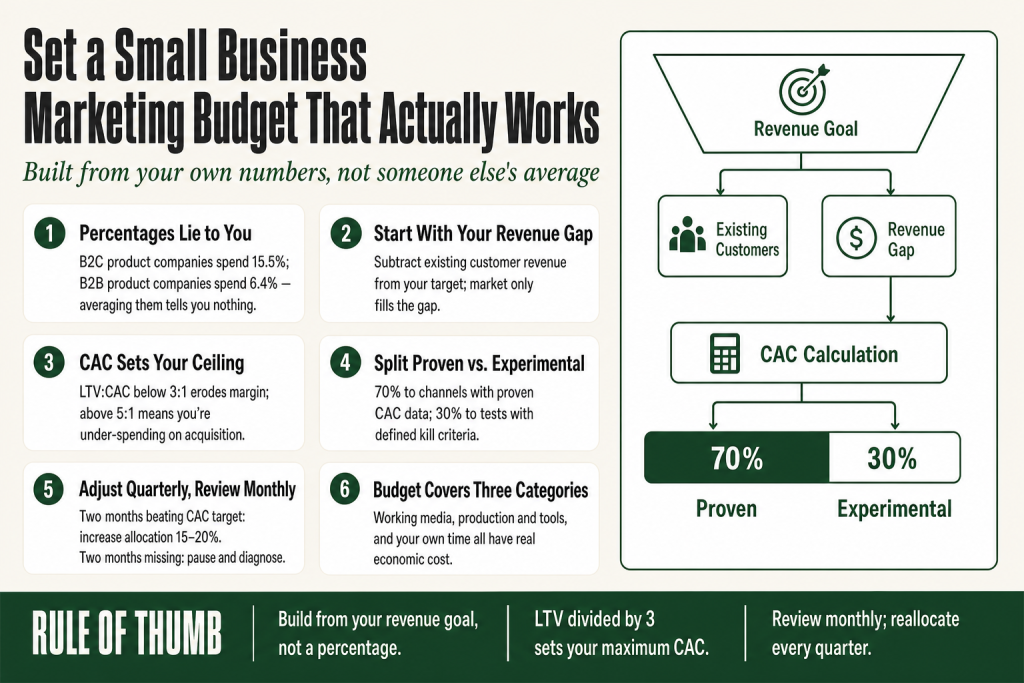
- Start with your revenue goal, not a percentage. Decide how many new customers you need, then work backward to a total marketing spend.
- Use CAC to find your ceiling. Your customer acquisition cost tells you the most you can spend per new customer and still grow profitably.
- Split the budget between proven and experimental. A common starting point is 70% on proven channels with 30% reserved for testing. Treat the ratio as a working hypothesis, not a fixed rule.
- Adjust quarterly, not annually. If a channel beats your target CAC, shift budget toward it. If it misses for two consecutive months, cut it or re-examine the creative before spending more.
- The percentage benchmarks are a gut-check, not a plan. Use them to sanity-check your number after you’ve built it from your own data.
- You own the judgment. AI tools can cut the time it takes to produce and iterate on marketing assets. The strategy calls, the read on what the data means, and every decision about what to scale or cut stay with you.
Take this fix into your next scenario. The free Builder’s Companion Kit collects the checklists and templates that pair with this guide — so next time, you start from a template, not a blank page. Grab it free →
- Why the Percentage Rule Doesn’t Work for Most Small Businesses
- Step 1: Work Backward From Your Revenue Goal
- Step 2: What Your Customer Acquisition Cost Tells You About the Budget Ceiling
- The Full Worked Example: How to Set a Marketing Budget for Small Business With Real Numbers
- Step 3: Split the Budget Between Proven and Experimental
- The Rule for Adjusting Your Budget as Results Come In
- What the Budget Actually Has to Cover
- FAQ
Knowing how to set a marketing budget for small business is one of those decisions that looks like a math problem but is really a judgment call dressed up in numbers. The internet hands you a percentage, usually somewhere between 7% and 10% of gross revenue, and tells you to multiply. That advice comes from surveys of large enterprises, averaged across industries so different they share almost nothing in common. A consumer packaged goods brand and a local HVAC company should not be working from the same number.
This article is written for the solo operator who is also their own marketing department: no agency on retainer, no dedicated marketing staff, just you deciding where the dollars go and whether the numbers make sense. The method works whether you’re spending $1,500 a month or $15,000, because it’s built from your economics, not someone else’s average.
What you actually need is a budget built from three specific inputs: the revenue you’re trying to hit, what your customer economics say you can afford to spend per new client, and a deliberate split between channels that are working and channels you’re still testing. That’s the whole method. The rest of this article shows you how to run those numbers with a single worked example so you can set a real dollar figure before the week is out.
Why the Percentage Rule Doesn’t Work for Most Small Businesses
Every few months someone publishes a new survey on marketing spend. Two of the most widely cited are the Gartner CMO Spend Survey and The CMO Survey sponsored by Deloitte, Duke University’s Fuqua School of Business, and the American Marketing Association. For 2025, Gartner (surveying 402 marketing leaders, the vast majority at companies with over $1 billion in annual revenue) put marketing budgets at 7.7% of company revenue, flat from the year before. The Deloitte/Duke/AMA CMO Survey, which samples a broader mix of U.S. company sizes including smaller firms, put the figure at 9.4% of company revenues. Those figures aren’t wrong exactly. They’re just useless for setting your budget.
Here’s the problem: the average masks a spread so wide it swallows the signal. The Deloitte/Duke survey shows B2C product companies allocating around 15.5% of revenue to marketing, while B2B product companies allocate around 6.4%. Averaging those together and handing you the midpoint tells you nothing about your business. The same logic applies inside any single industry.
The deeper issue is directional. A percentage of revenue is a historical measure. It tells you what your business spent relative to what it already earned. It says nothing about what you need to spend to hit the revenue you don’t have yet. That’s a completely different question, and it’s the one worth answering.
If you have no prior marketing data at all, the SBA guideline of roughly 7 to 8% of gross revenue for businesses under $5 million is a reasonable sanity-check floor. Use it to confirm your goal-driven number isn’t wildly off. Don’t use it to set the number in the first place.
Step 1: Work Backward From Your Revenue Goal
Pick a specific revenue target for the next 12 months. Not a wish, a number with a plan attached. Now subtract your projected revenue from existing customers and referrals. What’s left is the gap your marketing has to fill.
From that gap, you can back into customer count:
- Gap revenue divided by your average contract or order value gives you the number of new customers you need.
- That customer count, multiplied by what you currently pay to acquire one customer, gives you your minimum marketing spend.
This is where the math starts earning its keep. You’re no longer guessing at a percentage. You’re sizing the budget to a specific outcome.
A word of caution: if you don’t yet have reliable data on your average order value or customer acquisition cost, your first budget is necessarily an estimate. That’s fine. Set it, run it for 90 days, and then recalculate with real numbers. An imperfect budget you actually track beats a precise one you ignore.
Also note that this method assumes your marketing is the primary driver of new customers. If referrals carry most of your growth, your paid marketing budget can be smaller and your investment in a formal referral system (see building a referral program for your service business) may be worth more than another ad campaign.
Step 2: What Your Customer Acquisition Cost Tells You About the Budget Ceiling
Customer acquisition cost, or CAC, is the total you spend on sales and marketing divided by the number of new customers you win in the same period. The formula is straightforward:
CAC = Total Marketing and Sales Spend ÷ Number of New Customers Acquired
CAC matters because it sets a ceiling. You can’t sustainably spend more to acquire a customer than that customer is worth to you over their lifetime. The standard benchmark most practitioners cite for a healthy business is an LTV:CAC ratio of at least 3:1, a guideline popularized by David Skok’s SaaS Metrics 2.0 and now widely cited by sources including ChartMogul and Paddle. The 3:1 figure was originally framed as a minimum viability threshold for SaaS businesses, not a universal law, so treat it as a directional floor rather than a precise target. Above 5:1 and you’re probably under-spending on acquisition. Below 3:1 and you’re eroding margin with every new customer you win.
For a small service business, lifetime value is simpler than it sounds: average annual revenue from a client multiplied by how many years they typically stay, multiplied by your gross margin percentage. Use gross margin, not revenue. A $5,000 annual client with 60% margins has an LTV of $3,000 per year of retention, not $5,000.
Once you know your target CAC (LTV divided by 3 gives you a starting ceiling), you have a working constraint. Your budget must be set so that, at your expected conversion rate from lead to customer, you’re hitting that CAC or better. If your close rate is 20% and your target CAC is $500, you can afford to spend $100 per qualified lead.
This constraint is more useful than any percentage benchmark because it connects your marketing spend directly to your unit economics. It also tells you immediately when a channel is broken: if one channel’s CAC is running at 2x your target, either the channel isn’t right for your offer, or something upstream (the ad, the landing page, the follow-up) needs fixing before you spend more. Your lead follow-up process is often the silent driver of that number.
Honest caveat: if your business is newer than 12 months, your LTV estimate is noise, not data. In that case, use contribution margin per customer (what you actually pocket from a first transaction) as your ceiling for now, and tighten the model as you accumulate real cohort data.
The Full Worked Example: How to Set a Marketing Budget for Small Business With Real Numbers
Meet Clearwater Plumbing, a residential plumbing service doing $380,000 in annual revenue. The owner wants to grow to $500,000 over the next 12 months. Here’s how the math runs.
Step 1: Size the gap
- Revenue target: $500,000
- Projected revenue from returning customers and referrals: $340,000 (conservative hold)
- Gap to fill through marketing: $160,000
Step 2: Convert the gap to a customer count
- Average job value: $1,200
- New customers needed: $160,000 ÷ $1,200 = 134 new customers
Step 3: Find the CAC ceiling
- Average customer stays 3 years, averages 1.5 jobs per year at $1,200: LTV (revenue) = $5,400
- Gross margin: 55%, so LTV on margin = $2,970
- At a 3:1 LTV:CAC ratio (used here as a directional floor, per the Skok framework): maximum CAC = $2,970 ÷ 3 = $990
- Current actual CAC (last 12 months): $420 from Google Local Services Ads, $680 from Facebook Ads, $180 from referrals
Step 4: Build the total spend number
- 134 new customers × target blended CAC of $420 (using the best proven channel’s number) = $56,280
- Round to $57,000 annual budget, or $4,750 per month
- As a percentage check: $57,000 ÷ $500,000 target = 11.4%. That’s on the higher end, appropriate for a growth year.
Step 5: Apply the proven/experimental split (see next section)
- Proven channels (Google Local Services, referral incentives): $39,900 (70%)
- Experimental channels (Facebook retargeting test, local sponsorship): $17,100 (30%)
Tracking this as a solo operator
You don’t need a team or a business intelligence platform to keep these numbers current. A simple spreadsheet updated monthly covers it. One tab for channel-level spend (what went out, per channel, per month). One tab for new customers won and which channel sourced them. One tab that calculates CAC per channel by dividing spend by customers. That’s the whole system. The owner of Clearwater Plumbing needs exactly three data points per channel each month: dollars spent, leads generated, and jobs booked from those leads. Those three numbers give you CAC and conversion rate. Everything else is noise.
The harder part isn’t the math. It’s consistent attribution: knowing which channel actually sourced each new customer. A simple intake question at booking works fine for a local service business. ‘How did you find us?’ recorded in your CRM or even a notes field gives you the raw data. Pair that with UTM tracking on your digital channels and you can separate Google Local Services traffic from Facebook traffic in GA4 without any additional tools. The judgment call on what those numbers mean, which channel to scale and which to pause, stays with you. The spreadsheet just makes sure you’re reading real numbers when you make that call.
Step 3: Split the Budget Between Proven and Experimental
Once you have a total number, you need to distribute it. A widely cited approach among practitioners is a three-bucket framework: 70% to proven core channels, 20% to emerging bets with early traction, and 10% to genuine experiments. Improvado, Growth Method, Prescient AI, LikeMind Media, and Road9 Media all document this 70/20/10 structure. The framework’s roots trace to how Coca-Cola structured content investment under their “Content 2020” strategy (where Jonathan Mildenhall, then VP of Global Advertising Strategy, championed it as the NOW/NEXT/NEW model) and how Google applied the same ratio to engineering resources (as described by Eric Schmidt and Jonathan Rosenberg in How Google Works, 2014). The underlying logic is the same in both cases: you need reliable returns today and a tested pipeline of alternatives for tomorrow.
Multiple practitioners note that the exact ratios matter less than the principle behind them. Prescient AI describes the 70/20/10 rule as a practical framework that “works best when revisited regularly rather than treated as a permanent formula.” Growth Method similarly notes that the split is not a rigid rule: a startup with no proven channels might reasonably run 50/30/20, while a mature operation might sit closer to 80/15/5. The point is to allocate deliberately across all three categories, not to treat any specific percentage as universal.
For a solo operator running lean, the three-bucket version can simplify to a 70/30 split: 70% on channels with a demonstrated track record, 30% on testing what might work next. As Prescient AI notes, the 70/30 version is “generally used to describe a simpler split between proven, reliable marketing tactics and newer or more experimental efforts.” You’re collapsing the 20% and 10% buckets into one experimental pool, which is easier to manage when you’re the only person tracking it. Treat it as a practical starting point and adjust the ratio to fit your actual situation.
The logic cuts both ways. Put everything into proven channels and you’ll eventually hit their ceiling. Channels become more competitive, more expensive, or simply saturate your local audience. Without a pipeline of tested alternatives, you have no fallback when that happens. But put too much into experiments and you starve the reliable revenue engine that funds the tests in the first place.
Proven bucket (the 70% starting point): Channels where you have at least 90 days of data showing a CAC at or below your target. These are your workhorses. You’re not reinventing anything here. You’re scaling what you can prove.
Experimental bucket (the 30% starting point): Channels you’re genuinely testing. Each test needs a defined hypothesis, a minimum run time (60 days is a reasonable floor before you judge the result), and a clear kill criterion. If a test channel’s CAC is running at more than 1.5x your target after 60 days, end it or change the variable being tested. Don’t let experiments bleed into a third month on the same broken creative.
A few practical notes:
- Your experimental budget is not a slush fund. Assign it to specific tests with specific success metrics before you spend it.
- The experimental slice can shrink to 20% if cash is tight. It shouldn’t go to zero. The experimental slice is where next year’s proven budget comes from.
- Track channel-level CAC separately, not just a blended average. A blended CAC that looks healthy can hide one channel pulling the weight and another burning cash quietly. Your UTM naming convention is what makes channel-level CAC actually calculable in GA4.
If you’re running content marketing or SEO alongside paid channels, those belong in the proven bucket once they’re producing leads, or in the experimental bucket while you’re still building them out. For practical guidance on the organic side, the small business SEO checklist covers what to prioritize first.
The Rule for Adjusting Your Budget as Results Come In
Your budget is not a set-and-forget document. It’s a hypothesis you’re testing with real money. Here’s the adjustment rule:
Review your channel CAC every month. Reallocate every quarter.
Monthly review keeps you from spending another 30 days on a channel that’s clearly not working. Quarterly reallocation gives experiments enough runway to produce a real signal before you pull the plug or scale them up.
The specific triggers:
- If a channel’s CAC beats your target two months in a row: increase its allocation by 15 to 20% in the next quarter. Don’t double it overnight. Give the channel room to absorb the increased spend without performance degrading.
- If a channel’s CAC exceeds your target for two months running: pause new spend on that channel. Diagnose before you reallocate. The problem is often not the channel itself but something upstream: the ad creative, the landing page, or the offer. Fix one variable at a time. If you’re unsure whether the copy is carrying its weight, writing sharper copy is usually faster than switching channels.
- If your total new customer count is tracking ahead of plan: resist the reflex to cut the budget. Understand which channel is driving the overperformance and protect that allocation. You can redeploy savings from underperforming channels without touching the winner.
- If you’re consistently missing the revenue gap: before you increase the budget, check whether the issue is reach (not enough leads) or conversion (leads that don’t close). More ad spend on a broken funnel just generates more expensive failures. Review your funnel structure and your follow-up sequence before scaling spend.
One miss I made early on: I reviewed performance annually during budget season and made almost no in-year adjustments. By the time I reallocated, three months of budget had gone to a channel that stopped working in month four. Monthly reviews feel like overhead until you see what they protect.
The triggers above are rules, not algorithms. Every one of them still requires your read on the situation before you act. A channel can miss its CAC target in month one because of a one-time creative test, a seasonal lull, or an external event that temporarily suppressed demand. A channel can beat its target for two months because you ran a sale you can’t repeat. The rules give you a consistent basis for the decision. They don’t make the decision. You read the context, you weigh the variables, you decide. No tool, AI-assisted or otherwise, changes that. What the monthly review discipline does is make sure you’re deciding on real numbers instead of gut feel or stale data from last quarter.
What the Budget Actually Has to Cover
Before you finalize your number, make sure it accounts for all three categories of marketing spend, not just ad dollars.
- Working media: Paid ads, sponsored placements, boosted posts. This is what most people mean when they say ‘marketing budget’ and what they track most carefully. It should be the largest line item in most small business budgets.
- Production and tools: The cost of creating what you’re running. Ad creative, landing page software, email platform, your marketing tech stack. These costs are easy to undercount and tend to be fixed regardless of how much you spend on media.
- Time: If you’re the one running the campaigns, writing the copy, and pulling the reports, that time has a cost. It’s not a cash outflow, but it is a real economic cost. Factor it when you’re evaluating whether to keep a channel or hand it off. At some point, the time cost of running everything yourself exceeds what a contractor or a first marketing hire would cost.
A final note on tools and AI. AI-assisted production, from drafting copy to generating ad variations to summarizing your analytics, can reduce what you spend on execution in the production category. That’s a real efficiency gain worth taking. The Gartner 2025 CMO Spend Survey found that 22% of CMOs said GenAI has reduced their reliance on external agencies for creativity, which is a meaningful signal even if your operation is much smaller than their survey sample. What AI-assisted production does not do is supply the judgment the work requires. It doesn’t know which offer is right for your market, which channel is worth defending, or when a pattern in the data signals a real problem versus a noisy week. AI handles output. You decide what output is worth producing, what to scale, what to cut, and when the numbers are telling you something your gut already suspected. That read is yours. It doesn’t transfer to a tool. What it does transfer to is a better decision when you make it with cleaner data and more time to think, which is what the efficiency gain actually buys you.
FAQ
how much should a small business spend on marketing per month
Build from your revenue goal rather than a fixed monthly figure. Divide your annual marketing budget by 12 for a starting point, then let channel performance shift how you allocate it each quarter. For a small business under $1M in revenue, that figure often lands between $2,000 and $8,000 per month, but it should come from your customer economics, not a benchmark.
what percentage of revenue should go to marketing for a small business
The two most widely cited surveys put the figure in different places. The Gartner 2025 CMO Spend Survey (402 respondents, mostly companies with over $1 billion in revenue) found marketing budgets at 7.7% of company revenue, flat from 2024. The CMO Survey from Deloitte, Duke University’s Fuqua School, and the American Marketing Association (a broader mix of U.S. company sizes) put it at 9.4% of company revenues. The SBA guideline sits at 7 to 8% for businesses under $5 million. Use any of these as a sanity check after you’ve set your budget from your revenue goal and CAC. If your goal-driven number falls wildly outside that range, investigate why before committing.
what is a good customer acquisition cost for a small business
A good CAC is one that keeps your LTV:CAC ratio at 3:1 or better, meaning your average customer is worth at least three times what it cost to acquire them. That 3:1 figure comes from David Skok’s SaaS Metrics 2.0 and is widely used as a directional floor, though it was originally developed for SaaS businesses, so apply it with judgment in other contexts. The exact dollar amount varies enormously by industry and average order value. Calculate your own target CAC by dividing your customer lifetime value (on gross margin, not revenue) by 3, then verify it against your actual margins and retention data.
how do I know if my marketing budget is too low
The clearest signal is missing your new-customer target month after month despite reaching enough people. If your ads are getting impressions but not clicks, the creative or offer is the problem, not the budget. If you’re not generating enough leads in the first place, you may be under-spending on reach. Track channel-level CAC and lead volume separately so you can tell the difference.
should I cut my marketing budget when revenue is down
Usually not across the board. When revenue dips, cutting the marketing budget can create a compounding problem: fewer leads means fewer customers, which means less revenue to fund the next round of acquisition. Instead, cut experimental spend first and protect proven channels. If a channel’s CAC is still at target, that channel is working. Cutting it because cash is tight is a short-term fix with a long-term cost.
how often should I review and adjust my marketing budget
Review channel performance monthly so you catch problems before they run for a full quarter. Reallocate budget quarterly so experiments have enough runway to produce a real signal. Avoid locking your allocation for a full year. Markets shift, algorithms change, and a channel that outperformed in Q1 can underperform by Q3 for reasons you can’t predict in January.
Sources:
Sources: Gartner 2025 CMO Spend Survey (marketing budgets at 7.7% of company revenue, flat from 2024; survey of 402 CMOs and marketing leaders, vast majority at companies with over $1 billion in annual revenue); Deloitte/Duke University Fuqua School of Business/AMA CMO Survey 2025 (marketing budgets at 9.4% of company revenues, up from 7.7% in 2024; broader U.S. sample including smaller companies); U.S. Small Business Administration guideline of 7 to 8% of gross revenue for businesses under $5M; standard CAC formula (Total Marketing and Sales Spend ÷ New Customers Acquired) as documented by Amplitude, Corporate Finance Institute, and Zendesk; LTV:CAC 3:1 benchmark as established in David Skok’s SaaS Metrics 2.0 (originally framed as a minimum viability threshold) and cited as a directional floor by ChartMogul and Paddle; Deloitte/Duke CMO Survey 2025 showing B2C product companies at ~15.5% of revenue and B2B product companies at ~6.4% of revenue; 70/20/10 budget allocation framework as described by Improvado, Growth Method, and Prescient AI; Coca-Cola’s application of the NOW/NEXT/NEW version documented by LikeMind Media and Road9 Media, with attribution to Jonathan Mildenhall’s Content 2020 strategy per Growth Method; Google’s application to engineering resources per Eric Schmidt and Jonathan Rosenberg, How Google Works (2014), as cited by Growth Method; Prescient AI noting the 70/20/10 rule “works best when revisited regularly rather than treated as a permanent formula”; Prescient AI describing the 70/30 split as “generally used to describe a simpler split between proven, reliable marketing tactics and newer or more experimental efforts”; bootstrapped business CAC payback period target of under 6 months per Lead Systems Go analysis (December 2025); Gartner 2025 CMO Spend Survey finding that 22% of CMOs said GenAI has reduced their reliance on external agencies for creativity and strategy.
Brian Kasday spent forty years in direct-response marketing before rebuilding the whole operation as a one-person shop. He writes The Operator’s Library — including “Build a Complete Marketing Department” — for operators who’d rather build it themselves than wait on someone else.
Get the Builder’s Companion Kit — the free checklists and templates that pair with this guide: mmsvegas.com/resources.
This guide handles one marketing job. Build a Complete Marketing Department builds the whole department. See the manual →
More Marketing guides
Free · Marketing Operator Toolkit
Running marketing on your own?
Get the free toolkit — the templates and the expensive mistakes behind a one-person marketing department, plus a note when this guide changes.
Get the free toolkit →