
Last updated: July 2026
This page is going to give you one of the most practically useful numbers in small business, and tell you exactly how to use it. Contribution margin is revenue minus every variable cost that scales with a transaction. Calculate it right and you’ll know, for any product, any channel, or any customer, whether that relationship is building your business or just filling your calendar.
The reason most operators haven’t done this already isn’t complexity, it’s that the P&L doesn’t force the conversation. Gross margin is right there on the report. Contribution margin requires a deliberate build: you have to pull out shipping, processing fees, returns, discounts, variable labor, and sometimes acquisition cost, then do the subtraction. The operators who do that work make better pricing decisions, smarter product mix calls, and find out, often with real surprise, which of their biggest customers are actually eating into profit.
Revenue is easy to celebrate. Profit is harder to find. Contribution margin is where those two things meet, and where the decisions actually get made. By the end of this page, you’ll be calculating it at the unit, product, and customer level, and you’ll have a clear view of which relationships deserve your attention and which ones deserve a repricing conversation.
The idea in 30 seconds
- Contribution margin = revenue minus all variable costs, the dollar amount each sale contributes toward fixed costs and profit.
- It works at three levels: per unit, per product line, and per customer, each level surfaces different decisions.
- Gross margin flatters you by hiding variable costs like shipping, returns, discounts, and acquisition spend; contribution margin doesn’t.
- Operators use it to decide which products to push, which to kill, where to set prices, and which customers are worth keeping.
- Extend it to the customer level and you’ll find that a meaningful slice of your accounts are generating negative contribution, serving them costs more than they pay.
- You can run all of this in a spreadsheet. You don’t need software. You need the discipline to look.
Start Here: What This Actually Means for Your Business Right Now
Before the mechanics, here’s the pressure on operators in 2025: contribution margin is getting squeezed from multiple directions at once. According to the Q4 2025 MetLife/U.S. Chamber of Commerce Small Business Index, a quarterly survey of 754 small business owners conducted by Ipsos, 45% of small business owners cite inflation as their single biggest challenge, more than any other concern by a wide margin. Variable costs are the exact inputs that contribution margin tracks, and they’re the ones feeling inflation most acutely: shipping rates, supplier costs, payment processing fees, labor premiums.
On the tariff front, the numbers are stark. The Revenued Q3 2025 State of Small Business Report, which surveyed 131 SMB owners in July 2025, found that 67% of SMBs reported being directly impacted by tariffs in the past 12 months, with the impact showing up as higher costs for goods, supply chain delays, and forced supplier changes. That’s not an abstract policy story. That’s a variable cost story, and contribution margin is the lens that makes it visible.
On the DTC side, the squeeze shows up differently. Triple Whale’s 2025 ecommerce benchmarks, drawn from analysis of roughly 35,000 DTC brand accounts, found that Meta CPMs rose across every single industry vertical in 2025, with increases ranging from +8% to +38% depending on the category. For brands running paid acquisition that haven’t rebuilt their contribution margin model to reflect current ad costs, the math from even 12 months ago may be pointing in the wrong direction.
The practical upshot: contribution margin analysis isn’t a once-a-year exercise anymore. The inputs are moving fast enough that a calculation from six months ago may be telling you a story that’s no longer true. Build the model, then build the habit of refreshing it.
Where the Idea Came From
The specific breakthrough behind contribution margin, separating fixed costs from variable ones, became practically useful in the early 20th century, as factories grew complex enough that running one additional production shift became a real management question. Rent, insurance, and supervisory salaries didn’t change if the line ran one more hour; raw materials and direct labor did. Once you could isolate the variable piece, you could calculate exactly how much each incremental unit of output contributed to covering the overhead you’d already committed to paying.
Contribution margin became one of the key tools in cost-volume-profit analysis, the framework that answers questions like “how many units do I need to sell before I cover my fixed costs?” For most of the 20th century it lived in manufacturing finance. The more interesting extension came in 1989, when Harvard Business School professor Robert Kaplan wrote the Kanthal case, a study of a Swedish heating-systems manufacturer, to illustrate how activity-based costing, a method he had been developing with his colleague Robin Cooper since 1987, could be used to measure individual customer profitability for the first time at scale. The case number is HBS 190-002. That work gave rise to what became known as the whale curve: plot your customers from most to least profitable, track cumulative profit, and the line climbs past 100% before a tail of unprofitable accounts drags it back down. Kaplan and V.G. Narayanan later formalized the customer profitability framework in their September/October 2001 article in the Journal of Cost Management (Vol. 15, No. 5, pp. 5 to 15), making the variable-cost logic operational for a broad practitioner audience.
One note on attribution that trips up a lot of readers: Relevance Lost: The Rise and Fall of Management Accountingthe landmark 1987 book that diagnosed why traditional cost accounting fails operational decision-making, was co-authored by H. Thomas Johnson and Robert S. Kaplan, not by Kaplan alone. It’s frequently misattributed. Similarly, activity-based costing is properly credited to Cooper and Kaplan together, not to Kaplan in isolation. Get the attribution right if you cite it.
The Mechanics: Three Versions of the Same Number
There are three ways to express contribution margin, and each answers a slightly different question.
Unit contribution margin is the simplest: selling price minus variable cost per unit. If you charge $150 for a service appointment and the variable costs, labor at that rate, materials consumed, credit card fee, any commission, total $90, your unit contribution margin is $60. That $60 is what you have to work with after the cost of that specific transaction. Nothing more.
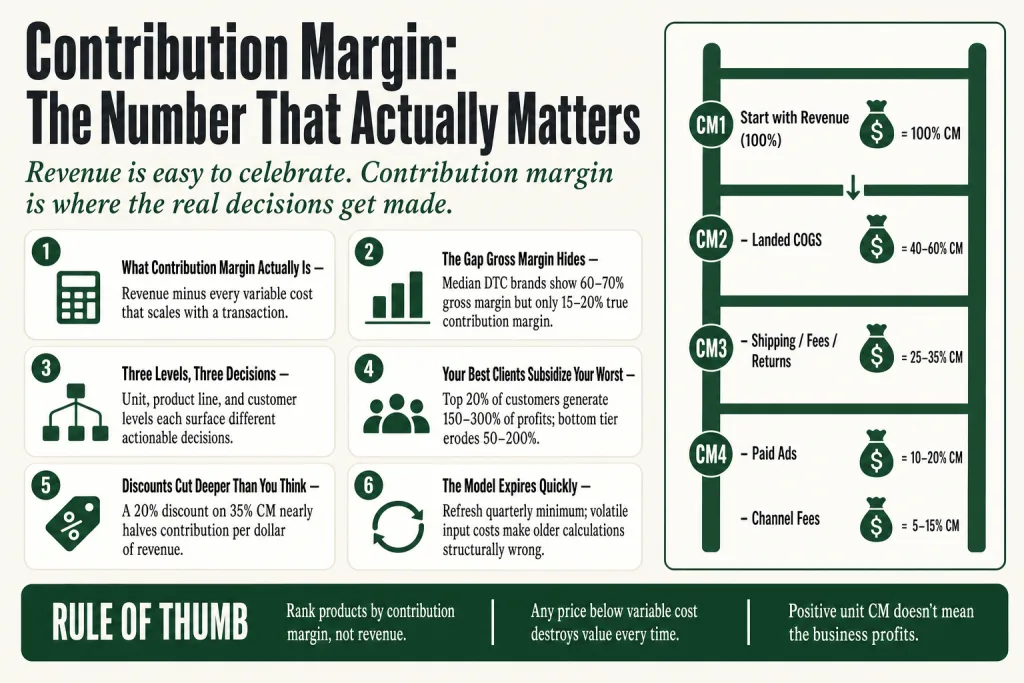
Contribution margin ratio expresses that as a percentage of revenue. Take your contribution margin, divide by revenue, and you get the share of each dollar that remains after variable costs. That ratio is what you compare across products, channels, and time. Triple Whale’s 2025 ecommerce benchmarks, drawn from more than 33,000 Shopify brands, put the median DTC brand near 15 to 20% true contribution margin, far below the 60 to 70% gross margin founders typically quote, because shipping eats 8 to 12%, payment processing takes roughly 2.9%, returns consume 6 to 10%, and ad spend absorbs 20 to 30% of revenue. The gap between gross margin and contribution margin ratio is where most operators’ assumptions about profitability live.
Break-even volume falls directly out of the math. Divide total fixed costs by unit contribution margin and you have the exact number of transactions you need before the business turns profitable. Every unit above that line is incrementally profitable; every one below it is a contribution toward overhead that hasn’t been covered yet.
The thing to hold onto: once total contribution margin across all transactions exceeds total fixed costs, the business makes money. If it doesn’t, it loses money, regardless of how fast revenue grows. Revenue growth without adequate contribution margin is just a faster route to the same shortfall.
What Counts as a Variable Cost?
For a product business, the list is relatively clear: cost of goods sold (landed cost, not factory-gate, since tariffs and inbound freight must be capitalized into inventory), sales commissions, payment processing fees, outbound shipping, packaging, and returns. For a service business it gets trickier. Variable costs are the ones that rise and fall with the volume or intensity of delivery, the hours a technician or consultant actually bills, materials consumed in the job, subcontractor fees, and software that scales per-seat or per-transaction. A full-time salary paid whether the person is busy or not isn’t variable until you actually cut the headcount.
One common trap: treating depreciation, allocated overhead, or salaried employees as variable costs. That inflates the variable cost number, understates contribution margin, and leads to overly pessimistic analyses, sometimes to the wrong call on whether to keep or cut a product. Keep the variable bucket clean. If the cost doesn’t move when volume moves, it doesn’t belong there.
Why Contribution Margin Beats Gross Margin for Operator Decisions
Gross margin gets reported on every P&L, so operators naturally anchor to it. The problem is that gross margin was designed for external financial reporting, not internal decision-making. It includes some fixed production costs in COGS and excludes costs like shipping, payment processing, and acquisition spend that vary directly with every transaction. Contribution margin strips down to only the costs that actually move with the sale.
Triple Whale’s 2025 benchmarks, across more than 33,000 Shopify brands, put median DTC gross margin at 60 to 70% gross margin but finish at just 15 to 20% true contribution margin after shipping, fees, returns, and paid ads. That’s a 40-to-50-point gap between the number most operators cite and the one that actually determines whether scaling is worth it.
Here’s what that looks like in practice. A product with a 78% gross margin looks like it can absorb aggressive discounts, free shipping, and still have room. Stack a 20% promotional discount, absorb $8 in outbound shipping, allocate a 3% payment processing fee, and reserve against a 15% return rate, and that 78% can collapse to something in the high 30s. Gross margin sets the ceiling. Contribution margin tells you how much of that ceiling actually flows through.
The multi-layer model that DTC operators use makes the logic visible and is worth knowing even if you don’t sell online. The four-level ladder runs CM1 (after landed COGS), CM2 (after shipping, fees, and returns), CM3 (after paid ads), and CM4 (after channel fees), a laddering convention common among DTC finance practitioners, applied here to the Triple Whale 2025 dataset. Where the number drops most between layers tells you which lever to pull: sourcing, fulfillment, acquisition efficiency, or return management. For a physical service business, the equivalent layers are gross margin on the job → minus variable labor overruns → minus any discount agreed during the sale → minus warranty or remediation work → minus direct support cost. That final number is what the customer relationship actually contributes. Most operators have never calculated it.
The Three Decisions Contribution Margin Actually Makes
1. Which Products to Push (and Which to Quietly Kill)
Revenue ranking and contribution margin ranking almost never match. A product line doing impressive volume might carry 14% contribution margin after all variable costs. A slower-moving line might contribute 55 cents of every dollar. Push the wrong one harder and you’re filling capacity with low-margin work while the high-margin line waits.
The specific question to ask: if I have limited capacity, shelf space, tech hours, production time, where does an additional unit do the most work? The answer is always the highest-contribution-margin product, not the highest-revenue one. A job paying $400 at 80% contribution beats one paying $600 at 30%, if both take the same time, because the first generates $320 toward fixed costs versus $180.
The zombie SKU problem is real in product businesses: a meaningful share of catalog items contribute negative margin while consuming warehouse space, ad budget, and operational attention. The same pattern shows up in service businesses, service lines launched to fill capacity or appease a key account, priced below the true variable cost once you account for all the friction they generate. They show up as revenue. They’re not helping.
2. Whether a Discount Is Affordable
A discount feels free when you have what looks like healthy gross margin. It isn’t. At 50% gross margin, a 20% discount requires roughly 67% more units sold just to generate the same gross profit dollars, and that’s before accounting for the long-term cost of training customers to expect promotions. The math on any promotional decision starts with contribution margin, not gross margin. If your contribution margin ratio on a product is 35% and you offer 20% off, you’ve just cut your contribution from 35 cents per dollar to roughly 19 cents, nearly halved. You’d need close to double the volume to generate the same contribution dollars. That math rarely works, but it’s invisible if you’re looking at the gross margin line instead.
3. Whether to Accept a Below-List Deal
A customer asks for 15% off in exchange for a bigger order or a multi-year commitment. The right question isn’t “can we afford it?”, it’s what does the contribution margin look like at the new price, and does the volume increase generate enough total contribution dollars to justify it? If the product contributes $40 at full price and a 15% discount brings it to $27.50, you need roughly 45% more volume at the new price just to generate the same total contribution. Sometimes the volume is real and it pencils out. Sometimes it isn’t and it doesn’t. Contribution margin makes the answer visible. Gut feel almost always says yes to the deal.
Putting this to work? The ideas in the Canon are the foundation under the tactical playbook in Build a Complete Marketing Department — grab the free companion kit at mmsvegas.com/resources.
The Most Overlooked Application: Contribution Margin at the Customer Level
Product-level contribution margin tells you what’s profitable to sell. Customer-level contribution margin tells you who’s profitable to sell to. Those aren’t the same question, and the second one is where most small operators have real money sitting unclaimed.
The idea: apply the same variable-cost logic to an individual customer relationship instead of a product. Take what they pay, subtract what you actually spend to serve them, discounts they’ve negotiated, returns they generate, support calls they make, special handling they require, payment terms that extend your cash cycle. What remains is their contribution to your fixed overhead and profit.
Two customers paying $500,000 a year can look identical on a revenue report and be completely different animals at the contribution margin level. One demands rush shipping, runs 60-day payment terms, and calls your support team weekly. The other orders in bulk, pays in 15 days, and handles their own problems. In a service business the equivalent is two clients on identical retainers: one sends five emails a week, scope-creeps every project, and disputes invoices; the other gives clear briefs, approves on schedule, and refers new business. Track only revenue and they look the same. Run the contribution math and they’re not close.
The intellectual lineage here is worth knowing. In 1989, Harvard Business School professor Robert Kaplan wrote the Kanthal case study (HBS 190-002), a solo-authored case about a Swedish heating-elements manufacturer, to show how activity-based costing could reveal which customers were actually profitable once you accounted for the cost of serving them. The whale curve emerged from that work: plot cumulative profit against customers ranked from most to least profitable, and the line climbs well above 100% before an unprofitable tail drags it back down. According to Kaplan and Narayanan’s 2001 article formalizing the framework, the most profitable 20% of customers typically generate between 150% and 300% of total profits, while the least profitable 10 to 20% erode 50 to 200% of what the top of the curve produced. The traditional 80/20 rule understates how concentrated, and how skewed, profitability actually is.
Your total reported profit is being propped up by a small group of high-contribution customers. If you could identify and exit, reprice, or restructure just the worst of those relationships, your overall contribution margin would rise without adding a single new customer.
Building a Simple Customer-Level Contribution Analysis
You don’t need activity-based costing software to do this. A spreadsheet with three columns gets you most of the way: what did this customer pay (net of discounts and returns), what did it directly cost to serve them (variable labor, materials, any specific handling), and what’s the remainder? For a B2B operator, add a fourth column for estimated support and sales time at a reasonable hourly rate. The exercise is clarifying even if the numbers are approximate.
Run the analysis on your top 20 accounts by revenue. Rank them by contribution margin, not revenue. The reordering is almost always surprising, and the accounts near the bottom of the contribution list deserve a repricing conversation or, if that fails, a quiet exit strategy.
For any customer with above-average return rates or support volume, model those costs explicitly. They compound. A customer with a 30% return rate is a very different animal than one at 5%, even if gross revenue is identical. Returns don’t just reduce revenue, they add reverse logistics cost, processing labor, restocking time, potential write-offs on unsellable inventory, and customer service overhead. Returns processing in apparel is commonly put at roughly $20 to $35 per return, a figure that circulates on fulfillment-vendor pages without a published sample, so treat it as a planning estimate rather than a measured rate; at a 25% return rate on a $75 AOV, that’s $8.75 per order in returns cost alone, larger than payment processing fees. Stack all of that against a frequent returner and the contribution picture changes fast.
How Modern Operators Use Contribution Margin
The DTC ecommerce world has built the most visible real-time application of contribution margin analysis, and the frameworks are worth knowing even if you run a local service business or a B2B consultancy.
Brands running paid acquisition on Meta and Google learned the hard way that revenue growth funded by advertising can be contribution-negative if CAC is high enough. Ad spend typically consumes 20 to 35% of DTC revenue, making it the single largest variable cost after COGS. At a 3.0x blended ROAS, roughly one-third of every revenue dollar goes back to Meta, Google, or TikTok before any other variable cost is deducted. The contribution margin after all variable costs including acquisition, CM3 in the four-layer framework, is the single test of whether you can profitably scale ad spend. A campaign might show a respectable 3.5x ROAS, but if the underlying product has a 30% return rate and gets sold via a 25%-off discount code, the actual contribution after all variable costs might be negative. Scaling that campaign means buying more losses faster.
Triple Whale’s 2025 benchmarks, across more than 33,000 Shopify brands, put the median DTC brand at 15 to 20% contribution margin after COGS, shipping, payment processing, returns, and ad spend. Top-quartile brands reach 28% or better. The spread within a single product category is often wider than the spread across categories, so comparing your number to a cross-industry average tells you very little. Benchmark against your own category and your own trajectory.
For professional services, the customer-level analysis surfaces the same dynamic it does in product businesses. The client generating a 55% gross margin per project but requiring three times the revision cycles, monthly status calls, and quarterly repricing negotiations may be contributing less than the client at 40% gross who runs clean. That’s not a relationship insight. It’s arithmetic.
For home services, contribution margin per job category often upends conventional wisdom. Emergency calls command premium pricing but can actually contribute less per hour once you factor in after-hours labor premiums, dispatch overhead, and the higher incidence of warranty callbacks. The bread-and-butter scheduled maintenance route turns out to carry the business. The analysis doesn’t say stop taking emergency calls. It says price them to reflect what they actually cost.
Where Contribution Margin Analysis Works Best
Contribution margin is most powerful when you have meaningful cost variability, a significant portion of your costs actually changing with volume. That’s true of most product businesses, most job-based service businesses, and any model with variable acquisition costs baked in.
It’s particularly useful in four situations:
- Product or service line decisions. If you’re considering adding a new service, the first financial question is: what’s the variable cost of delivering it, and what does the contribution margin look like at the target price? If you can’t answer that, the decision is a guess dressed up as a plan.
- Capacity allocation. When you have limited capacity, billable hours, machine time, shelf space, and more options than you can serve, contribution margin per unit of constrained resource (per hour, per square foot) tells you where to point it. A job paying $400 at 80% contribution beats one paying $600 at 30% if both take the same time, because the first generates $320 toward fixed costs versus $180.
- Pricing floors. Any price above variable cost makes a positive contribution. Any price below it destroys value with every transaction. Contribution margin defines the floor below which no volume justifies the deal.
- Scaling decisions. Before you add a location, hire staff, or increase ad spend, contribution margin tells you whether the economics justify the additional fixed cost commitment. If your current contribution margin ratio is 35% and you’re considering a fixed overhead increase of $8,000 per month, you need $22,900 in additional revenue just to cover it before you see any additional profit.
Where the Analysis Gets Unreliable
Contribution margin is not an all-purpose profit oracle. There are contexts where it misleads or simply doesn’t apply cleanly.
When cost classification is ambiguous. The model requires a clear line between fixed and variable costs. In many small businesses, that line is blurry. A semi-variable cost, like a manager who gets busier as volume rises but isn’t hired or fired based on any single job, doesn’t fit cleanly in either bucket. Forcing it into ‘variable’ overstates contribution margin. Forcing it into ‘fixed’ understates it. The right move is to model it separately, but most operators simplify and introduce some error.
When interdependencies are strong. If two products are bundled, cross-sold, or share variable resources, their individual contribution margins can mislead. Cutting a low-margin product that happens to bring customers in who buy your high-margin product is a bad call based on good math, if you didn’t model the interdependency. Always ask: what else does this product or customer bring with it?
At very low scale. When volume is low enough that you’re really asking ‘do I have enough customers to cover rent,’ the break-even framing is more useful than product-level margin comparison. You need enough total contribution first; optimizing the mix is a later-stage problem.
As a substitute for strategy. Contribution margin tells you what’s working now, under current pricing, current costs, current customer behavior. It’s a diagnostic, not a compass. A product with a low contribution margin because you’re pricing below equilibrium to gain share might be exactly right strategically. The number doesn’t know the context. You do.
When input costs are shifting fast. The Federal Reserve’s 2025 Small Business Credit Survey, fielded September through November 2025 across 6,525 employer firms, found that 48% of small businesses sourced at least some inputs from outside the United States, and a large majority of those firms reported that those international inputs increased in price from 2024 to 2025. If your supplier costs or tariff-driven landed costs are moving, and right now they are, contribution margin calculations built on even recent historical data will be wrong by the time you act on them. Model the current number, not the one from last quarter.
What People Get Wrong About Contribution Margin
Confusing it with gross margin. Gross margin subtracts cost of goods sold, which includes some fixed production costs, from revenue. Contribution margin subtracts only the variable costs that move with each transaction: direct materials, shipping, processing fees, discounts, returns. If you’re making decisions based on gross margin and calling it contribution margin, you’re overestimating profitability on almost every transaction. A useful way to think about the distinction: gross margin tells you whether the product is priced above what it costs to make and land. Contribution margin tells you whether the business keeps anything after shipping the box, paying the processor, eating the return, and buying the customer.
Thinking a positive contribution margin means the business is profitable. It means each sale is making a positive contribution to covering fixed costs, a good sign, but not the same as profit. If total contribution margin across all sales doesn’t exceed total fixed costs, you’re still losing money regardless of how healthy each unit looks.
Using it to evaluate sunk costs. Contribution margin is a forward-looking tool. The cost of a machine you already bought, the salary of a team you’ve already committed to, those are sunk. The question contribution margin answers is: given what’s already fixed, does this next sale, product, or customer help or hurt?
Applying it as a single blended number. A single blended contribution margin for the entire business masks variation across products, channels, and customers. The blended number is a summary. The product- and customer-level numbers are the actionable ones.
Treating it as static. Your costs from last year are not your costs today. Supplier prices change, labor rates increase, shipping costs fluctuate, and tariff-driven landed costs shift with policy changes. Review and update your contribution margin calculations at minimum quarterly, monthly if you operate in a volatile cost environment.
Common Mistakes
- Using gross margin as a proxy for contribution margin when setting discounts — Before any promotional offer or volume discount, rebuild the math at contribution margin. A 20% discount on a product with 35% contribution margin cuts per-dollar contribution from 35 cents to roughly 19 cents, nearly halved. You’d need close to double the volume to generate the same total contribution dollars. If your promotional terms were set when variable costs were lower, recalculate them at current shipping rates and CPMs before running them again. The question to answer: does the expected volume lift actually cover the contribution you’re giving up?
- Cutting a low-CM product without modeling what it pulls with it — Before you discontinue anything, quantify the downstream effect, specifically, what percentage of buyers of that product also purchase your higher-margin lines, and what happens to those purchases if the low-margin SKU disappears. A product at 12% contribution margin in isolation might be triggering your 58%-margin upsell for 40% of buyers. The net contribution impact of removal is what matters, not the product’s own margin number. Run the scenario in a spreadsheet before you make the call: cut the SKU, apply the expected attach-rate drop to adjacent lines, and see whether total contribution goes up or down.
- Never running contribution margin at the customer level — Take your top 15 accounts by revenue and build a simple three-column spreadsheet: net revenue (after discounts and returns), direct variable cost to serve, and the difference. Add a fourth column for estimated support and sales time if you’re in B2B. Rank the result by contribution margin. The reordering from revenue rank to contribution rank almost always surfaces at least one account in your top five by revenue that belongs near the bottom by contribution. Kaplan and Narayanan’s 2001 research showed that the least profitable customer tier can erode 50 to 200% of what the most profitable tier generates. Run the ranking before your next contract renewal cycle.
- Treating the model as a one-time calculation rather than an input that expires — Set a recurring calendar reminder, quarterly at minimum, monthly if your input costs are volatile, to update the three most important variable cost inputs: landed COGS (especially if you source internationally), outbound shipping rates, and your blended ad CPM. Each time you update, run one sensitivity scenario: what does contribution margin look like at variable costs 10% higher than today? That scenario, run consistently, converts the model from a historical snapshot into an early-warning system.
- Applying contribution margin to a sunk cost decision — If you’re asking ‘was it worth buying that machine?’ or ‘should we have signed that lease?’, contribution margin isn’t the right tool. It’s forward-looking: given what’s already committed, does the next transaction, product, or customer help or hurt? The useful framing when you’re sitting on a sunk cost is: what contribution does the asset or commitment generate going forward, and is that contribution above the incremental variable cost of continuing to use it? That’s the question. The original capital outlay is no longer part of the decision.
Operator’s Take
Pull your top five products or service lines right now and do this before you move on. For each one, write down the selling price and every variable cost you can identify, materials, shipping, processing, commissions, returns reserve. If you’ve been sourcing from international suppliers, use landed cost at current tariff rates, not last year’s invoice price. The tariff situation alone has shifted enough in the past 18 months that a model built in early 2024 can be structurally wrong today. Calculate contribution margin for each. Then rank them.
My guess: the ranking doesn’t match what you’d have predicted going in. That surprise is the whole point. You’re not running this exercise to confirm what you already think, you’re running it because the P&L is hiding something. And in most cases, at least one of your top-revenue lines is carrying less contribution than a quieter line you’ve been underinvesting in.
Now do the same for your top 15 revenue accounts. Estimate what each one actually costs to serve, the negotiated discounts, return volume, support calls, rework cycles, payment terms. Rank those by contribution margin, not revenue. The accounts near the bottom fall into three buckets: reprice, restructure the service terms, or quietly let them go. That’s not a relationship judgment. It’s the math telling you where your capacity is going and what it’s coming back as. Your best clients are subsidizing your worst ones. That’s worth knowing before the next renewal conversation.
Three specific moves, in order of effort:
Check your discount structure against contribution margin, not gross margin. A 20%-off offer set when variable costs were lower may be deeply contribution-negative today. Don’t assume the promotional math still works, recalculate it at current landed costs and current ad CPMs before you run it again. If you find it’s negative, you have two options: raise the price floor on the offer, or cut the promotion. Neither is comfortable. Both beat running losses at scale.
Flag your three highest-friction customers before the next billing cycle. High support volume, frequent scope changes, late payments, high return rates, pick the dimension that costs you most and run the contribution number on those accounts specifically. You don’t need to exit anyone immediately. You need to know who’s worth a structured repricing conversation and who’s effectively being carried by your better clients. That distinction changes how you prepare for renewal.
Treat your contribution margin model as a living document. The inputs, Meta CPMs, shipping rates, supplier costs, are moving faster than they were two years ago. Build the model in a spreadsheet, set a quarterly reminder to update the cost inputs, and run one sensitivity scenario each time: what does contribution margin look like if variable costs rise another 10%? That single habit, done consistently, catches drift before it becomes a structural problem that requires a price increase your customers aren’t expecting.
Two honest caveats before you act on anything. First: don’t cut a low-CM product based purely on its ratio in isolation. Ask what it brings with it, does it anchor a bundle, generate traffic for higher-margin items, or retain customers who’d otherwise leave? The number is an input to the decision, not the decision itself. Second: this analysis is only as good as your cost classification. If variable costs are lumped with fixed costs in your books, or if you’re on cash-basis accounting that doesn’t match revenue timing, your contribution numbers will be wrong in ways that feel precise. Clean cost classification is a prerequisite. Start with your two highest-revenue products and two highest-friction customers if the full build feels heavy. Four data points, done carefully, beat a broad analysis done sloppily.
The AI tools available now, ChatGPT, Claude, Copilot in Excel, can build a contribution margin model from a description of your cost structure in a few minutes and run sensitivity scenarios that most operators would never bother doing manually. Use them to cut the friction of the calculation. The interpretation stays yours, the bundle dependency, the relationship dynamics, the strategic intent behind a pricing decision. Those don’t show up in a spreadsheet, and no model produces them. That judgment is still the operator’s job.
Used in
- ✓ Build a Complete Marketing Department
Used to evaluate which acquisition channels and offers generate sufficient contribution margin to justify continued investment, revenue alone is not the criterion. - ✓ The Missing Manual for FunnelKit
Used when setting order bump and upsell pricing, the contribution margin on each additional offer determines whether a funnel step improves or erodes overall unit economics. - ✓ The Missing Manual for Make
Used to justify automation builds by comparing the variable cost reduction against fixed automation overhead, the contribution margin improvement must outpace the new fixed cost.
FAQ
What’s the difference between contribution margin and gross margin?
Gross margin subtracts cost of goods sold, which includes some fixed production costs, from revenue. Contribution margin subtracts only the variable costs that move with each transaction: direct materials, shipping, processing fees, discounts, returns. Contribution margin is almost always a more conservative and more accurate number for operational decision-making. Triple Whale’s 2025 benchmarks, across more than 33,000 Shopify brands, put the typical gap at 40 to 50 points for DTC businesses.
Can a business survive with a low contribution margin?
Yes, if volume is high enough that total contribution dollars cover fixed costs and generate acceptable profit. Grocery retail runs on thin contribution margins and survives through enormous volume and tight cost control. The question is always whether total contribution across all transactions exceeds total fixed overhead, the ratio alone doesn’t determine viability.
Should I include my own salary as a variable cost?
Not if you’d pay yourself the same regardless of how many units you sell or clients you serve. Owner compensation is typically a fixed cost. If you take draws only when specific jobs close, model it as variable. The test: does this cost actually change with output volume?
How do I calculate contribution margin for a service business?
Start with the revenue from a client or project, then subtract: variable labor (hours billed at your effective labor rate), materials consumed, any direct subcontractor costs, and variable selling costs like commissions. What remains is the contribution margin for that engagement. Salaried staff not billing to that specific project are fixed overhead, not variable cost.
What’s a good contribution margin for a small business?
It depends on your fixed cost structure and industry. Triple Whale’s 2025 benchmarks, across more than 33,000 Shopify brands, put median DTC contribution margin at 15 to 20% after all variable costs including acquisition; top-quartile DTC brands reach 28% or better. The meaningful benchmark isn’t a cross-industry average, it’s whether your total contribution covers your fixed costs with enough left to hit your target profit.
How often should I recalculate contribution margin?
Quarterly at minimum, monthly if your input costs are volatile. The Federal Reserve’s 2025 Small Business Credit Survey, 6,525 employer firms fielded September through November 2025, found that 48% of small businesses source at least some inputs from outside the United States, and a large majority of those reported international input prices increased from 2024 to 2025. If you source physical goods from international suppliers, rebuild the model whenever a meaningful policy change hits your COGS.
Further reading
- ‘Relevance Lost: The Rise and Fall of Management Accounting’ by H. Thomas Johnson and Robert S. Kaplan (Harvard Business School Press, 1987), the book that diagnosed why traditional cost accounting fails operators making real-time decisions; the historical context for why contribution margin matters. Note the authorship: it’s Johnson and Kaplan, not Kaplan alone, a common misattribution.
- ‘Profit First’ by Mike Michalowicz, a small-business cash management system that implicitly depends on understanding which revenue actually contributes to overhead versus getting consumed by variable costs before it arrives.
- ‘Simple Numbers, Straight Talk, Big Profits’ by Greg Crabtree, a practical guide to using contribution margin and labor efficiency ratios to diagnose small business profitability without an accounting degree.
- Kaplan, R.S. and Narayanan, V.G. ‘Measuring and Managing Customer Profitability,’ Journal of Cost ManagementVol. 15, No. 5, September/October 2001, pp. 5 to 15the article that gave practitioners a structured method for applying activity-based cost logic to individual customer relationships. The whale curve itself originates in Kaplan’s earlier solo-authored 1989 Kanthal case study (HBS 190-002), which applied activity-based costing, developed by Kaplan together with Robin Cooper, to reveal dramatic customer-level profitability variation at a Swedish heating-elements manufacturer.
Sources:
Triple Whale 2025 Ecommerce Benchmarks (analysis of ~35,000 DTC brand accounts, Meta CPM increases by vertical, ranging +8.08% to +38.03% year-over-year; median DTC marketing efficiency data); The DTC benchmark figures on this page (median contribution margin, returns rates, ad-spend share of revenue) trace to Triple Whale’s 2025 Ecommerce Benchmarks, cited directly above. Several consultancy and agency pages republish those same numbers; they were removed in an October 2026 review because citing a restatement adds no evidence, and the returns-cost figures that appear only on such pages, with no stated sample, were dropped with them. MetLife/U.S. Chamber of Commerce/Ipsos Small Business Index Q4 2025 (survey of 754 small business owners, October 9 to 29 2025 to 45% cite inflation as top challenge); Revenued Q3 2025 State of Small Business Report (surveyed 131 SMB owners, July 2025 to 67% of SMBs directly impacted by tariffs in past 12 months); Federal Reserve Banks 2025 Small Business Credit Survey / 2026 Report on Employer Firms (fedsmallbusiness.org, 6,525 employer firms, fielded September 3, November 14, 2025 to 48% sourcing inputs from outside U.S. large majority reporting international input price increases); Federal Reserve Bank of New York / Liberty Street Economics, ‘Effect of Tariffs on U.S. Small Businesses,’ July 2026 (drawing on 2025 SBCS data, tariff challenge rates by sector); Kaplan, R.S. and Narayanan, V.G. ‘Measuring and Managing Customer Profitability,’ Journal of Cost ManagementVol. 15, No. 5, September/October 2001, pp. 5 to 15 (whale curve of cumulative customer profitability, most profitable 20% of customers generate 150 to 300% of total profits; least profitable 10 to 20% erode 50 to 200% of total profits); Kaplan, R.S. ‘Kanthal (A),’ Harvard Business School Case 190-002, July 1989, revised April 2001 (original solo-authored whale curve case study); Cooper, R. and Kaplan, R.S. ‘How Cost Accounting Distorts Product Costs,’ in Bruns, W.J. and Kaplan, R.S. (eds.), Accounting and Management: Field Study PerspectivesHarvard Business School Press, 1987 (foundational activity-based costing work); Kaplan, R.S. and Cooper, R. Cost & Effect: Using Integrated Cost Systems to Drive Profitability and PerformanceHarvard Business School Press, 1998; Johnson, H.T. and Kaplan, R.S. Relevance Lost: The Rise and Fall of Management AccountingHarvard Business School Press, 1987.
Brian Kasday spent forty years in direct-response marketing before rebuilding the whole operation as a one-person shop. He writes The Operator’s Library — including “Build a Complete Marketing Department” — for operators who’d rather build it themselves than wait on someone else.
Build the department these ideas describe — the free companion kit: mmsvegas.com/resources.
More The Operator's Canon guides
Free · Operator Toolkit
Want the tools, not just the guide?
Get the free operator toolkit — templates and checklists for the systems you actually run, plus a note when this guide changes.
Get the free toolkit →How to cite: Contribution Margin. The Operator’s Canon, MMS Vegas. https://mmsvegas.com/library/contribution-margin-explained/