
Last updated: July 2026
The van westendorp price sensitivity meter is a four-question survey that tells you the price range your customers will accept, and just as importantly, the floor below which they’ll start questioning whether your product is any good. By the end of this page, you’ll know how to run the survey yourself, read the outputs without a statistician, and make a defensible pricing decision before you ever go to market.
Most operators set prices one of three ways: they copy a competitor, they calculate cost-plus and add a margin, or they go with gut feel and quietly panic when conversion is slow. None of those approaches tells you what’s actually going on inside a buyer’s head when they see your number. Price isn’t just a transaction figure, it’s a signal about quality, a filter for the right customers, and a ceiling on how big your offer can get. Setting it wrong in either direction costs you.
That’s the specific problem the PSM was designed to solve: not “what will people pay?” (a question people answer optimistically and dishonestly) but “where does price start to feel wrong?” Those are very different questions, and the second one gets you much more useful data.
The idea in 30 seconds
- The van westendorp price sensitivity meter asks four questions, too cheap, bargain, expensive, and too expensive, to map the price range your market will accept.
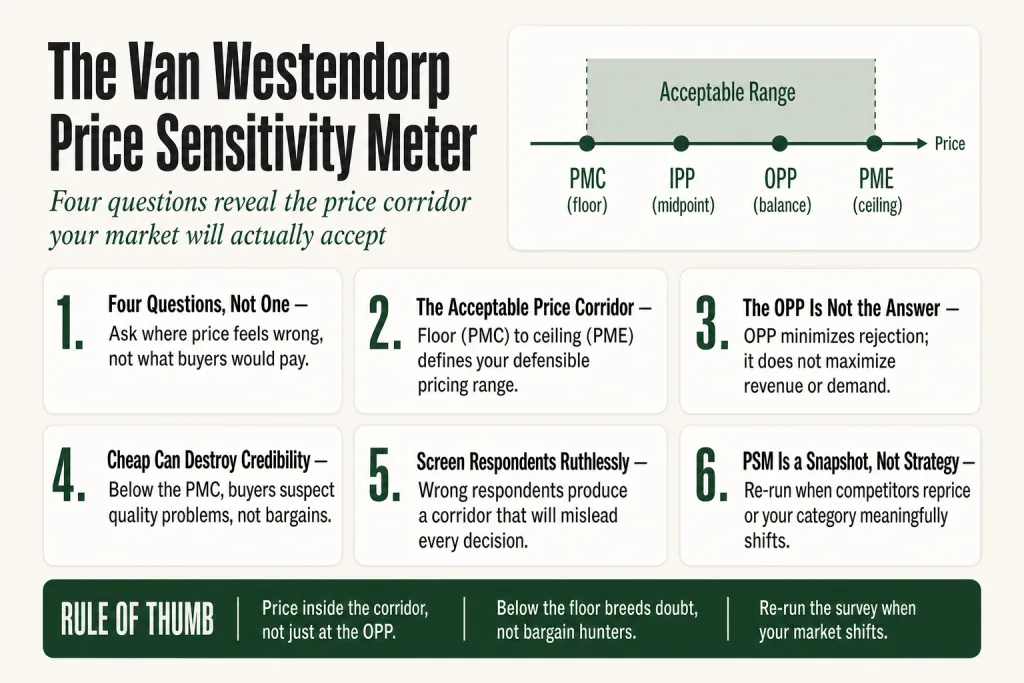
- The outputs are four curves whose intersections give you a floor (PMC), ceiling (PME), psychological midpoint (IPP), and a balance point (OPP).
- The method is fast, cheap, and requires no pricing history, making it ideal before a launch or reposition.
- It tells you about perceptionsnot purchase volume. You still need to overlay your margins and test in-market.
- Underpricing is a real risk, prices below the floor trigger quality suspicion, not just bargain excitement.
- Run it before you build your offer stack, not after you’ve already printed the price sheet.
Where It Came From
The Price Sensitivity Meter was introduced in 1976 by Dutch economist Peter van Westendorp, presented at that year’s ESOMAR Congress. He was a practitioner showing other practitioners a field-ready tool, not writing an academic paper for a journal nobody reads.
The core insight was durable: buyers form price judgments on a spectrum with psychological thresholds, not at a single number. PSM gave marketers a structured way to surface those thresholds without running expensive experiments, four plain-language questions that, when plotted as cumulative curves, revealed where perception breaks down at both ends of a price range. The method spread through market research practice and pricing literature across the 1980s and ’90s, and is still used essentially intact nearly fifty years later. That’s a decent run for any framework.
Extensions to the original, most notably the Newton/Miller/Smith Purchase Intent addition from the early 1990s, later layered demand estimation onto PSM’s perception outputs. But the core four questions haven’t changed, and neither has the reason people reach for the tool first.
The Van Westendorp Price Sensitivity Meter: The Four Questions
The whole thing runs on four open-ended survey questions. Each respondent answers all four for the same product or service you’re testing. The questions, slightly paraphrased for clarity, are:
- Too cheap: At what price would this feel so inexpensive that you’d question the quality and wouldn’t consider buying it?
- Bargain: At what price would this feel like a great deal, a real buy for the money?
- Expensive: At what price would this start to feel expensive, though you’d still consider buying it?
- Too expensive: At what price would this be so expensive you wouldn’t even consider it?
By plotting cumulative perception curves for these four series and reading off their intersections, the PSM locates the prices where buyer resistance is balanced, without ever asking “what would you pay?” directly. That indirection is the whole trick. Ask someone what they’d pay and they anchor low. Ask them where something feels wrong, and they reveal how they actually think about price.
Use open-ended numeric fields for each answer, this is integral to the PSM method. Don’t give price ranges as options; that primes responses and defeats the purpose. Let respondents name their own numbers.
Notice Question 1, the “too cheap” question. This is the one most operators mentally skip, because the instinct is that cheap is never a problem. It is. If you price a professional service at half what anyone else charges, you don’t get a flood of grateful clients. You get skeptical ones asking what’s wrong with you.
Reading the Outputs: PMC, PME, IPP, and OPP
Once the surveys are in, you plot four cumulative frequency curves on a shared price axis, one curve per question. The curves cross each other at four named points. Each intersection tells you something specific.
The Acceptable Price Range (PMC to PME)
There is no single right price after conducting a van Westendorp survey. The acceptable price range lies between the point of marginal cheapness (PMC) and the point of marginal expensiveness (PME).
- PMC (Point of Marginal Cheapness)where the ‘too cheap’ and ‘expensive’ curves intersect. This is your floor. Below it, too many respondents start doubting quality.
- PME (Point of Marginal Expensiveness)where the ‘too expensive’ and ‘cheap’ curves intersect. This is your ceiling. Above it, too many respondents walk away on price alone.
The Two Anchor Points
- IPP (Indifference Price Point)the intersection of the ‘cheap’ and ‘expensive’ curves, representing the price at which equal proportions perceive the product as cheap or expensive. Think of this as the market’s gut sense of a ‘normal’ price for something like this, often close to the prevailing category rate.
- OPP (Optimal Price Point)the intersection of the ‘too cheap’ and ‘too expensive’ lines. The point where an equal number of respondents object from either extreme. ‘Optimal’ here means the tradeoff between the two kinds of rejection is balanced, not that this is the revenue-maximizing price.
That last point matters. The OPP name is genuinely misleading. PSM outputs are perception-based, not volume forecasts. The OPP tells you where extreme rejection from both ends is minimized, it doesn’t predict demand, revenue, or margin. Treat it as one reference anchor inside the corridor, not the destination.
In practice, most operators end up choosing a price somewhere between the IPP and PME, above the psychological midpoint, but short of the ceiling. That’s where premium positioning lives without triggering sticker shock. Where exactly you land within that range is a business strategy question the survey can’t answer for you.
You typically need at least 100 to 300 responses from your target audience for meaningful price sensitivity curves. For a small operator running a first-time pricing study, 100 to 150 qualified respondents will give you useful directional data. Treat the range as the finding, not the OPP as gospel. A wide PMC-to-PME corridor signals a price-tolerant market. A narrow one tells you buyers are sensitive and you don’t have much room to maneuver.
How to Run It as a Small Operator
You don’t need a market research agency or a six-figure budget. Here’s the practical version.
Step 1: Define What You’re Testing
The PSM works on a clearly bounded offer, a single product, a specific service package, or one subscription tier. It gets unreliable when you’re testing a vague “our full suite of services.” Write a two-to-three sentence description of exactly what’s included. Show it to respondents before the questions. If they don’t understand what they’re pricing, their numbers mean nothing.
Step 2: Recruit the Right People
Your respondents need to be actual or plausible buyers, not your friends, not your existing customers who already have price anchors baked in, and not random email list subscribers with no skin in the game. For B2B operators, that means surveying decision-makers, not end users who don’t hold the purchasing relationship.
The PSM works for services, subscriptions, and SaaS pricing as long as respondents understand the offering well enough to evaluate price. For services, this usually means giving a brief scope description. For a subscription, frame the questions around the recurring price, monthly or annual fee, so respondents evaluate the ongoing commitment, not a theoretical one-time purchase.
Step 3: Build the Survey
Online surveys to a screened panel of research participants tend to be among the most effective approaches. Tools like Typeform, SurveyMonkey, or Google Forms work fine for collecting the raw numbers. Several platforms, including Conjointly and Metricgate, have free PSM templates that will auto-generate the curves and intersection points for you.
Add a basic logic check: if someone’s “too cheap” answer is higher than their “too expensive” answer, their data is unusable. Most platforms can flag this automatically.
Step 4: Analyze and Plot
Export your four data columns, sort them, build cumulative frequency distributions, and plot them. The intersections give you PMC, PME, IPP, and OPP. Before you send the survey out, ask two to four people outside the product team to take it live and discuss their answers, you’ll catch ambiguous wording before it contaminates a full data set. Free Excel templates exist for exactly this purpose; Conjointly offers one publicly.
Step 5: Overlay Business Reality
PSM is an input, not the verdict. Overlay your margin floors, competitive benchmarks, and positioning intent, then validate in market. If your PMC comes out at $97 but your cost structure requires $120 to be profitable, you have a positioning problem masquerading as a pricing decision. If your PME comes out at $300 and your instinct was to price at $149, you may be leaving real money on the table. Either way, the survey didn’t make your decision. It informed it.
For most small operators, running a simple A/B test on two price points within the acceptable range, say, at the IPP and somewhere between the IPP and PME, is the most practical next step after the survey. Use PSM for fast perception ranges; add Gabor, Granger to estimate purchase incidence; then use A/B tests to finalize operational prices.
Putting this to work? The ideas in the Canon are the foundation under the tactical playbook in Build a Complete Marketing Department — grab the free companion kit at mmsvegas.com/resources.
Putting This to Work
Working through a PSM study isn’t complicated, but the sequence matters. The most common error isn’t in the analysis, it’s in what operators do before the first question goes out.
Start with the product stimulus. Write two to three tight sentences describing exactly what’s in the offer: what’s delivered, over what timeframe, and what’s excluded. If you’re testing a monthly retainer, say what the client gets each month. If it’s a SaaS tier, list the three or four features that define it. This description runs above the four questions in the survey and it sets the frame. Get it wrong and respondents price a vague impression of your category, not your actual offer.
Then think hard about who you’re sending it to. Not your list. Your buyer. If you serve agency owners, don’t survey freelancers. If your buyer is a VP of Operations, don’t survey coordinators. The PSM’s corridor is only as useful as the people who drew it.
Once the data’s in, resist the pull to report only the OPP. The full corridor, PMC to PME, is where the insight lives. Map where your current or intended price sits inside it, note whether the corridor is wide or narrow, and flag any tension with your margin floor. That three-part read is what turns raw output into an actionable brief.
One more thing: if your study returns a PMC higher than where you planned to price, don’t rationalize it away. That’s the survey telling you your positioning may be underselling the offer, not that the buyer wants to pay more for the same thing. Respond to the signal. Strengthen the value framing, then price accordingly.
Where the Van Westendorp Price Sensitivity Meter Works Best
The van Westendorp approach is well suited for studying a product or service that is relatively new to the world, where there aren’t well-established prices for similar or competing offerings. That description fits most small operators most of the time. You’re not Tide detergent with forty years of shelf pricing data. You’re a consultant, a software founder, or a boutique service provider trying to price something that doesn’t have a clean market comp.
The PSM shines in four specific situations:
- New product or service launchespricing consultants use PSM early in the process, especially for launches and repositioning, to scope price corridors and set initial list prices before competitive anchors exist.
- Repositioning an existing offerwhen you’re moving upmarket or restructuring your packages, a PSM tells you whether your target segment’s acceptable range has shifted from where you currently sit.
- Subscription and SaaS pricingthe method’s speed and low cost keep it relevant for getting to a defensible price range before a launch window closes, particularly when conjoint analysis would take months you don’t have.
- Professional servicesservice-based businesses often benefit from PSM because pricing is less anchored to material costs and more influenced by perceived value.
One underused application: testing the price of a new tier against your existing customers, separately from testing it against prospects. The acceptable range for someone who already trusts you is often higher than the range for a cold prospect. That gap is your upsell room.
Where the Van Westendorp Price Sensitivity Meter Doesn’t Work
The PSM has real limits, and researchers have been candid about them for decades.
True luxury goods. Because the PSM assumes price is a reflection of quality, it breaks down for Veblen goods, things people buy because they’re expensive. If your entire positioning strategy is status pricing, this tool won’t serve you.
No competitive context. The van Westendorp approach ignores the competitive context, which is often cited as its biggest weakness. Respondents answer in a vacuum. If your market has a well-known dominant player at a known price, your PSM output will be distorted by that anchor, either inflated by aspirational comparison or deflated by ‘why would I pay more than X?’ The survey can’t capture those dynamics the way conjoint analysis can.
It doesn’t predict volume. PSM cannot tell you how price changes will impact sales volume. It surfaces how customers perceive price fairness. Actual willingness to pay is measured through live A/B tests or Gabor, Granger surveys that model purchase intent at explicit prices. Conjoint analysis can infer relative willingness to pay from changes in marginal utility. PSM gives you a perception corridor, not a revenue forecast.
Established product categories. For products and services where competitive prices are well-known to buyers, methods like monadic pricing questions and conjoint analysis are usually better approaches for pinning down an optimal price.
Complex, multi-attribute offers. The van Westendorp price sensitivity meter is typically limited to studying a single or a very few product formulations, as compared to conjoint analysis which can cover thousands of potential product formulations within the same research study. If your offer involves a lot of moving pieces, bundles, add-ons, feature tiers, conjoint will serve you better.
What People Get Wrong About the Van Westendorp Price Sensitivity Meter
Misunderstanding 1: The OPP is the price you should charge. It isn’t. The ‘optimal price point’ label is one of the PSM’s most misleading features. PSM outputs are perception-based, not volume forecasts. The OPP tells you where extreme rejection from both ends is minimized, it does not predict demand, revenue, or margin. Treat it as one reference anchor inside the corridor, not the destination.
Misunderstanding 2: Lower is always better, or at least safer. This is the one that costs operators the most money. The PSM makes the ‘too cheap’ threshold visible in a way that a simple ‘what would you pay?’ survey never does. A service priced below the PMC doesn’t attract bargain-hunters; it attracts skeptics. The floor isn’t just a lower limit on revenue, it’s a lower limit on credibility.
Misunderstanding 3: Running the survey once is enough. The PSM is a snapshot, not a standing readout. Markets shift, competitors enter, and categories mature. Re-run the survey when you’re repositioning, when a new competitor establishes a strong price anchor, or when your category has meaningfully changed.
Misunderstanding 4: Any respondents will do. When respondents have no comparative reference point for your offer, their price estimates anchor on unrelated products or arbitrary numbers. Screened, qualified respondents who match your actual buyer persona are non-negotiable. Two separate studies with the right people beats one large study with the wrong ones every time.
Misunderstanding 5: The survey replaces pricing strategy. PSM tells you where the market’s psychological range sits. It says nothing about where you should sit within that range given your positioning, margin needs, or competitive intent. That’s still an operator judgment call, and no survey will make it for you.
Common Mistakes
- Sending the van Westendorp survey to your full email list — Your general list is full of people who follow you but would never buy, lurkers, competitors, past customers with outdated price anchors. A coaching business owner sent her PSM to 4,000 newsletter subscribers and got a PME of $497. Her actual buyer segment showed a PME above $2,000. Screen respondents before they see a single question: they must match your buyer profile and hold real budget authority. Run two targeted studies rather than one large contaminated one.
- Launching at the OPP without checking the corridor — A SaaS founder ran a clean PSM, saw the OPP land at $29/month, and launched at exactly $29. His PME was $79. He left roughly $50/month per customer on the table for eighteen months before a re-test surfaced it. Price inside the full PMC-to-PME corridor after overlaying your margin requirements and competitive position, the OPP is a reference point, not a revenue-maximizing answer.
- Skipping the product description stimulus before the four questions — Without a concrete scope description shown before the four questions, respondents price a vague idea of your offer, not the actual thing. A consultancy testing a $15,000 retainer got scattered, unusable results because the survey said only ‘monthly advisory service.’ Retested with a two-paragraph scope description, the corridor tightened by 40% and became actionable. Write the stimulus first. It is not optional context.
- Never re-running the van Westendorp price sensitivity meter after market conditions shift — A subscription software company priced at the IPP in 2021 and never revisited the data. By 2023, two funded competitors had entered at lower price points, effectively pulling the category’s reference price down. Churn spiked before anyone thought to re-run the PSM. Trigger a fresh study when a competitor sets a new price anchor in your market, when you add a meaningful new tier, or when you’re planning an increase of more than 15%.
- Pricing below the PMC because ‘affordable’ feels safe — A freelance strategist priced her retainer at $1,500/month. Her PSM showed a PMC of $2,200. Prospects who didn’t hire her weren’t balking at cost, some were questioning her credibility because the number felt too low for the scope she described. She raised to $2,400, conversion improved, and onboarding got easier because clients arrived with appropriate expectations. Below the floor isn’t safe. It’s where quality doubt lives.
Operator’s Take
Here’s the thing about the PSM that nobody tells you upfront: the survey is the easy part. The hard part is what happens when the results come back and they conflict with what you wanted to hear.
The most common case I see, and the most expensive, is an operator who prices below the PMC because it feels safer or more accessible. They’ve convinced themselves that a lower price removes friction. It does remove friction, but it also removes credibility. Prospects who don’t convert aren’t always flinching at cost. Some of them are looking at your number and quietly concluding that something’s off. A freelance strategist I know priced her retainer at $1,500/month. Her PSM showed a PMC of $2,200. She raised to $2,400, conversion improved, and she stopped getting the slow, suspicious onboarding conversations that had been draining her time. Below the floor isn’t safe. It’s where quality doubt lives.
The OPP gets way too much attention. Operators run the survey, spot the OPP, and treat it like the answer. It’s not. It’s one intersection on a chart, the point where equal numbers of respondents reject the price from either extreme. That tells you something, but not what you actually need to know. What you need to know is the shape of the whole corridor. How wide is it? Where do your margins put you inside it? Is the OPP near the PMC or near the PME? Those questions determine whether you have flexibility or whether you’re boxed in.
There’s a real challenge right now that doesn’t get discussed enough: inflation and interest-rate cycles have been shifting category reference prices faster than most operators re-run their research. A SaaS team that priced at the IPP in 2021 and never revisited it may be sitting in a category whose ceiling has moved, up or down, by 30% or more. Markets drift. If you haven’t checked in eighteen months, the corridor you’re operating from is probably stale.
The other current challenge is survey fatigue and panel quality. Screened research panels have gotten noisier. Response fraud on cheap panel sources is real enough that researchers document it. For a small operator who can’t afford a premium panel, the practical workaround is to recruit respondents personally, your network, referrals from existing clients, industry communities, even if it means collecting 100 responses over three weeks instead of 400 overnight. Slower and smaller beats fast and contaminated every time. One contaminated study that sends you to the wrong corridor costs you months.
A word on where AI fits into this workflow: it can write a tight product stimulus description in your brand voice, clean inconsistent responses from your raw export (the ones where ‘too cheap’ lands higher than ‘too expensive’), and build the cumulative frequency distributions once your data is clean. Those are genuine time savings. What it can’t do is tell you whether the corridor conflicts with your margin structure, whether a PMC higher than your planned price means your positioning needs work, or how to sequence a price increase without losing existing accounts. That reasoning stays with you.
Run the PSM before the offer goes public. Then run it again when you’re adding a tier, planning a meaningful price increase, or when a well-funded competitor enters and resets the reference price in your category. Think of it less like a founding document and more like a blood pressure check, useful precisely because you do it regularly, not once.
Used in
- ✓ Build a Complete Marketing Department
Used to establish a defensible price range before finalizing offer structure, ensuring the central offer sits within the market’s acceptable corridor rather than defaulting to cost-plus or competitor shadowing. - ✓ The Missing Manual for FunnelKit
Used to inform the price points displayed at each funnel stage, ensuring order bumps, upsells, and core offers are anchored within the PSM’s acceptable range before the funnel is built. - ✓ The Missing Manual for Make
Used to automate the collection and tabulation of PSM survey responses, routing form submissions into a spreadsheet that auto-generates cumulative curves and intersection points without manual data handling.
FAQ
How many responses do I need for a reliable van Westendorp study?
For stable, segment-level curves, aim for 200 to 400 respondents per segment. For a small operator running an initial directional study, 100 to 150 qualified responses will give you useful guardrails, just interpret the output as a range to explore, not a precise optimum.
Can I run a van Westendorp survey for a service business, not a physical product?
Yes. The method works well for services and subscriptions because pricing is driven more by perceived value than material cost. Frame the questions around the specific deliverable or recurring commitment, and give respondents a clear scope description before the four questions.
What’s the difference between the OPP and the IPP?
The OPP (Optimal Price Point) is where equal numbers of respondents find the price either too cheap or too expensive, it minimizes extreme rejection from both ends. The IPP (Indifference Price Point) is where equal numbers consider the price cheap vs. expensive, representing what the market perceives as a normal or expected price for the category.
Is the van Westendorp PSM better than conjoint analysis?
They do different things. PSM is faster and cheaper, and it’s excellent for mapping an acceptable range when you have no pricing history or competitive benchmark. Conjoint analysis is more rigorous and models how buyers trade off price against product attributes, better for established categories, complex offers, or when you need volume forecasts alongside price perception.
Can the van Westendorp PSM tell me whether to raise my existing prices?
Indirectly, yes. If your current price sits below the PMC of your target segment, you have room, and possibly a quality-perception problem. If it sits near the PME, a price increase is risky without a repositioning move. Run a fresh study with qualified respondents who haven’t already anchored on your existing price.
What’s the biggest mistake operators make with the PSM?
Treating the Optimal Price Point as the answer and ignoring the range. The corridor between the PMC and PME is the real deliverable, where you land within it is a judgment call based on your positioning, margins, and competitive intent.
Further reading
- Van Westendorp, P. (1976), “NSS-Price Sensitivity Meter (PSM), A New Approach to Study Consumer Perception of Price,” Proceedings of the ESOMAR Congressthe original source; worth tracking down if you want to understand what the method was and wasn’t claiming to do.
- Monetizing Innovation by Madhavan Ramaswamy and Georg Tackea practical book on value-based pricing that puts PSM in context alongside willingness-to-pay research and segmentation; useful for operators ready to go deeper than the four questions.
- Conjointly’s free PSM calculator and Excel template (conjointly.com)the fastest way to go from raw survey data to plotted curves without hiring a statistician.
Sources: Peter van Westendorp, “NSS-Price Sensitivity Meter (PSM), A New Approach to Study Consumer Perception of Price,” ESOMAR Congress Proceedings, 1976. Wikipedia, “Van Westendorp’s Price Sensitivity Meter.” Umbrex Frameworks Library (umbrex.com). Sawtooth Software blog, “Van Westendorp Pricing Model.” Conjointly product documentation (conjointly.com). Quantilope PSM glossary (quantilope.com). Morning Consult, “Eliciting Better Pricing Insights Through Conjoint Experiments.” Contribution.dk, “Van Westendorp Price Sensitivity Meter for Price Research.” Metricgate PSM Calculator documentation (metricgate.com). GetMonetizely, “Van Westendorp PSM for SaaS Research.” Resonio, “Van Westendorp Price Sensitivity Meter: How to Set a Price.” SurveyKing, “The Van Westendorp Pricing Model Explained.” QuantUX Blog, “Intro to the Van Westendorp Pricing Exercise.” Relevant Insights, “Making the Case Against the Van Westendorp Price Sensitivity Meter.”
Brian Kasday spent forty years in direct-response marketing before rebuilding the whole operation as a one-person shop. He writes The Operator’s Library — including “Build a Complete Marketing Department” — for operators who’d rather build it themselves than wait on someone else.
Build the department these ideas describe — the free companion kit: mmsvegas.com/resources.
More The Operator's Canon guides
Free · Operator Toolkit
Want the tools, not just the guide?
Get the free operator toolkit — templates and checklists for the systems you actually run, plus a note when this guide changes.
Get the free toolkit →How to cite: Van Westendorp Price Sensitivity Meter. Associated with Peter van Westendorp, 1976. The Operator’s Canon, MMS Vegas. https://mmsvegas.com/library/van-westendorp-price-sensitivity-meter-explained/