
Last updated: July 2026
The CAC LTV ratio is the math underneath every marketing budget decision you’ll ever make: it answers whether acquiring another customer is worth what it costs to get them. By the end of this page, you’ll be able to calculate your own ratio, recognize what it’s telling you, and make a confident call about whether to pour more fuel into acquisition or fix something upstream first.
Most small-business operators have a feel for whether their marketing is ‘working’, leads are coming in, sales are closing, revenue is up. What they often don’t have is a clean answer to a harder question: is each new customer adding value, or are we just trading dollars for activity? That distinction is everything. A business growing at 30% a year can still be slowly destroying itself if the economics underneath the growth are broken.
That’s what this ratio surfaces. The arithmetic isn’t complicated, you almost certainly already have the inputs sitting somewhere in your books and your CRM. The hard part isn’t the math. It’s accepting what the number says and deciding what to do about it.
The idea in 30 seconds
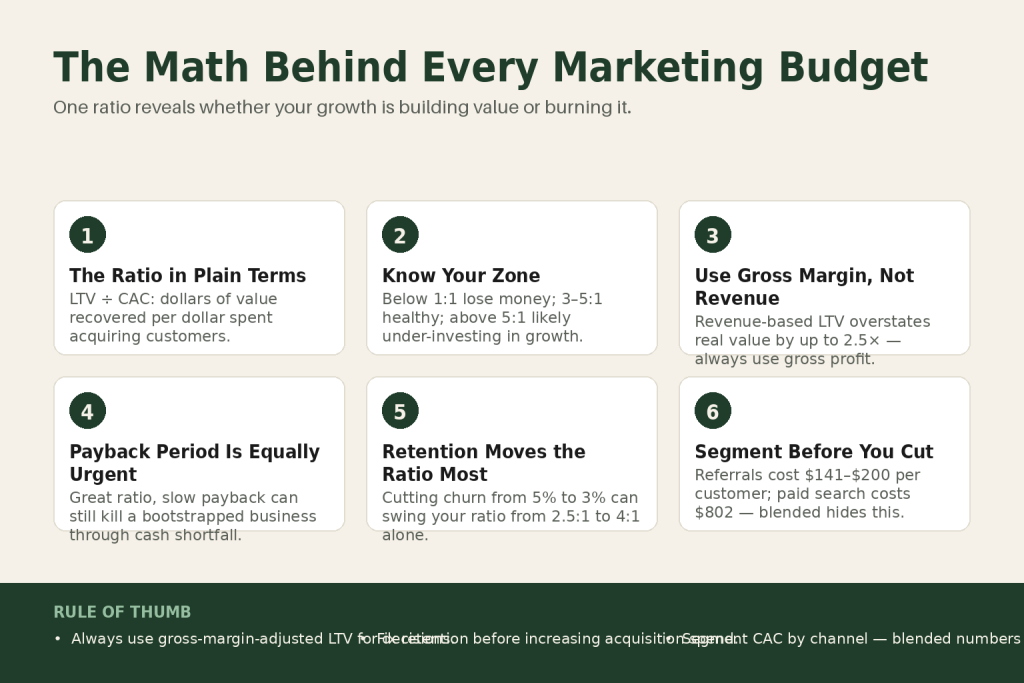
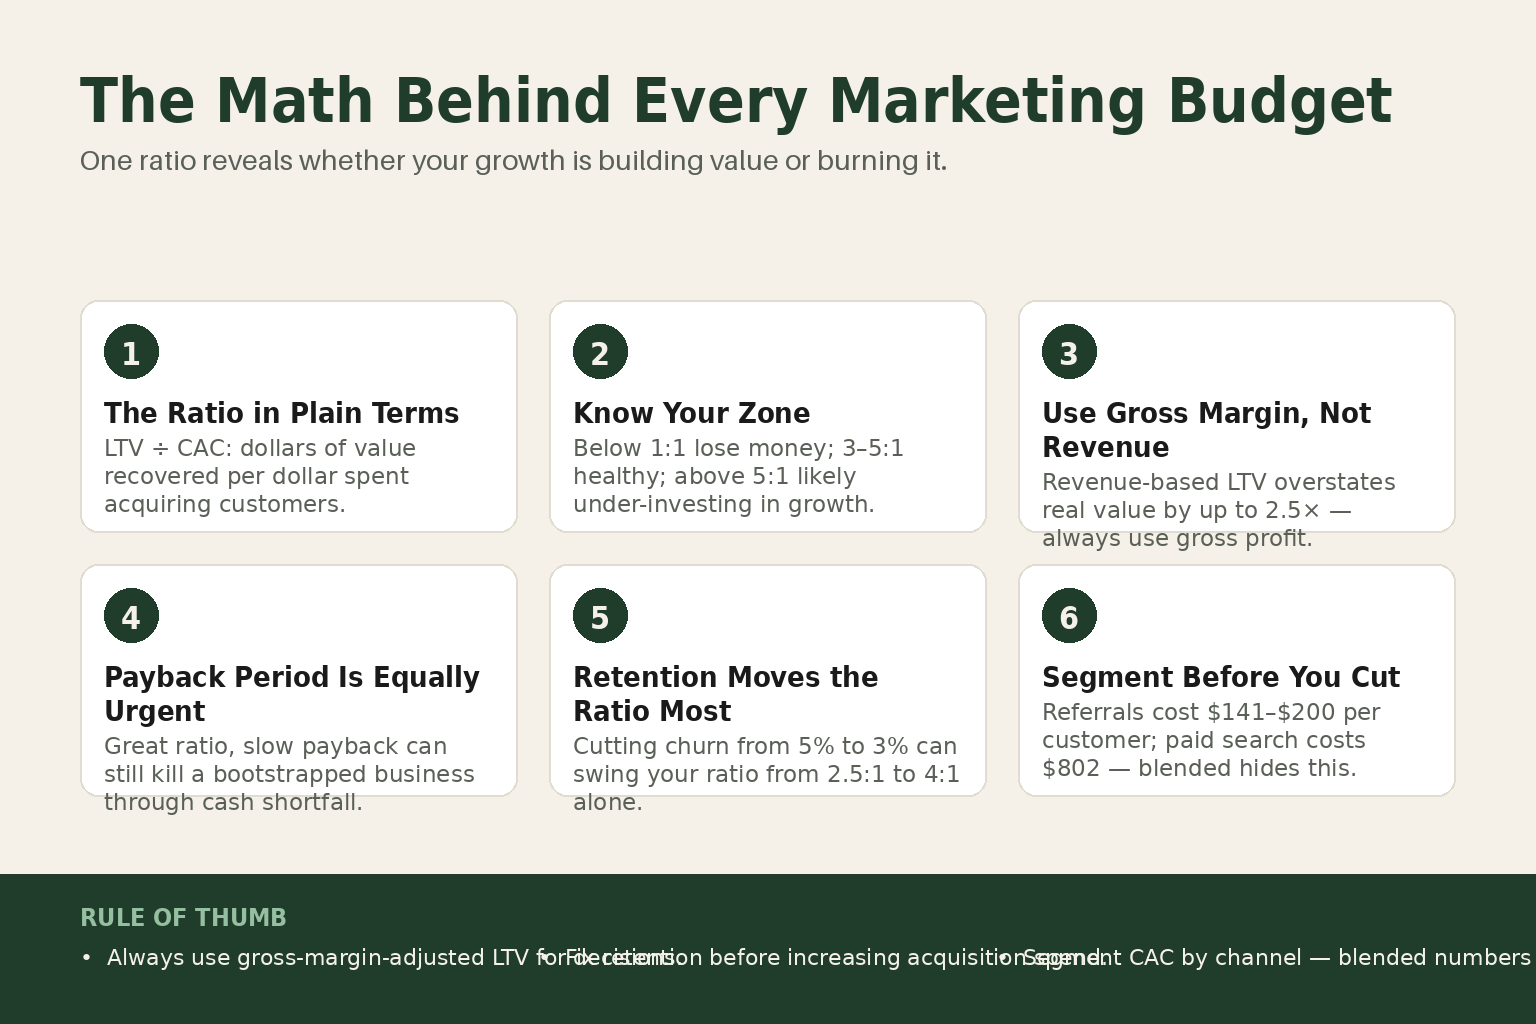
- The CAC LTV ratio divides what a customer is worth over their lifetime by what it cost you to acquire them, the result tells you whether your acquisition model is sustainable.
- A ratio below 1:1 means you lose money on every new customer. Below 3:1, you’re running thin. At 3:1 and above, you have real margin to work with and room to grow.
- Revenue-based LTV overstates the real number. Always use gross-margin-adjusted LTV for decisions that involve spending money.
- The ratio has a companion metric you can’t ignore: CAC payback periodhow many months of contribution margin it takes to recover what you spent to land the customer.
- A high ratio (above 5:1) isn’t automatically good. It often means you’re under-investing in growth and handing market share to competitors willing to spend.
- The fastest single lever to improve this ratio is almost always retentionnot cheaper ads, a small churn reduction compounds hard in the LTV formula.
Where the Idea Came From
The vocabulary around acquisition cost versus lifetime value sharpened after the dot-com collapse. When early internet companies imploded in 2000, the common autopsy finding wasn’t a bad product, it was unit economics that never made sense. Companies had been spending $400 to acquire a customer worth $80 and calling it growth. Investors who survived that era started demanding founders prove profitability on a per-customer basis before scaling spend.
Around 2009 to 2010, David Skok of Matrix Partners published what became widely cited as ‘SaaS Metrics 2.0’ on his ForEntrepreneurs blog. The 3:1 LTV:CAC threshold that operators still quote today was derived from his observations of mature public SaaS companies, HubSpot, Salesforce, NetSuite, at steady state with stable churn and multi-year customer lifetimes. It was always a floor, not a target, though you’d never know that from how often people treat it as a finish line. Bessemer Venture Partners built on that work in their Atlas cloud framework, setting segment-specific CAC payback targets that remain a standard reference for investors. Lech Kaniuk, serial entrepreneur, co-founder of PizzaPortal (acquired by Delivery Hero) and SunRoof, and author of The Two Numbers That Build or Break Every Businessextended the framework further, drawing on firsthand experience watching companies celebrate revenue while their unit economics quietly fell apart.
One thing worth knowing about the 3:1 benchmark: it was derived from SaaS businesses with recurring revenue, high gross margins (75 to 90%), and contractually defined customer lifetimes. Applied to a dry cleaner or a landscaping company, the threshold still makes intuitive sense, one dollar in, three dollars out, keep the difference, but the inputs and the failure modes look different. The concept travels; the context doesn’t automatically come with it.
The CAC LTV Ratio: What You’re Actually Calculating
The ratio itself is simple. Divide lifetime value by customer acquisition cost: LTV ÷ CAC. The result tells you how many dollars of value you recover for every dollar you spend to acquire a customer.
The trouble is in the inputs. Both numbers have easy versions and honest versions, and the easy versions will mislead you.
Customer Acquisition Cost (CAC)
CAC equals total go-to-market spend divided by new customers acquired in a specific period. ‘Total go-to-market spend’ is what most operators undercount. Add up all direct marketing expenses, ad spend, content creation, team salaries, tools, events, plus all sales expenses including compensation, tools, training, and commissions. Every hour a salesperson spends on a prospect that converts, every software subscription that touches the acquisition process, every piece of collateral, it belongs in the numerator. Skip the unsexy costs and your CAC looks better than it is.
Use both blended and segmented CAC. Blended gives you a quick health check; segmented by channel and customer type gives you the precision to allocate dollars where the unit economics are strongest. Referrals run at $141, $200 per B2B customer against $802 for paid search, a cost gap of up to 5x between your most and least efficient channels. A blended number hides the fact that your Google Ads customers might be profitable while your trade-show customers are a disaster, or vice versa.
Lifetime Value (LTV)
For a simple non-subscription business, the formula is: LTV = Average Order Value × Purchases per Year × Average Customer Lifespan (in years). For a subscription or recurring-revenue business: LTV = (ARPU × Gross Margin) ÷ Churn Rate.
That gross margin piece matters more than most operators realize. Use the gross-margin-adjusted version for any decision that involves spending money, revenue-based LTV overstates the actual value whenever margins aren’t 100%. A $200/month customer with 40% margin has an LTV of $1,600, not $4,000. Running the calculation on revenue instead of gross profit is the most expensive error in this framework, it overstates your unit economics by 2.5× and makes acquisition spend look justified when it isn’t.
A Worked Example
Say you run a local accounting firm. Your average client pays $3,500 per year, stays for four years, and your gross margin, after staff time and software, is 55%. Your fully-loaded CAC, including your sales process, referral dinners, Google ads, and your own time, is $1,800.
LTV = $3,500 × 4 years × 55% = $7,700. Ratio = $7,700 ÷ $1,800 = 4.3:1. Solid. Now ask: what happens if average tenure drops to 2.5 years because you quietly stopped a client follow-up program? LTV falls to $4,812. Ratio drops to 2.7:1. Suddenly you’re in the yellow zone, not because acquisition got more expensive, but because retention slipped without anyone noticing.
That’s the diagnostic value of the ratio. It reacts to changes you might not catch on a revenue chart.
The Companion Metric You Can’t Skip: CAC Payback Period
The LTV:CAC ratio tells you whether an acquisition model is sustainable over a customer’s full lifetime. The CAC payback period tells you something different and equally urgent: how long until that customer’s contribution margin covers what you spent to acquire them.
A business can have a great long-run ratio and still run out of cash if the payback is too slow. A company with a 5:1 LTV:CAC ratio but a 30-month payback still needs enormous working capital to grow. Cash timing kills companies faster than profitability ratios.
The calculation: if it costs $1,200 to acquire a customer and you make $100 in gross profit per month from that customer, your payback period is 12 months. After those 12 months, each additional dollar from that customer contributes straight to profit and cash flow.
Bessemer Venture Partners’ Atlas framework sets payback targets by customer segment: under 12 months for SMB-focused businesses, under 18 months for mid-market, and under 24 months for enterprise. Those targets reflect a real structural difference, smaller customers churn faster, so their acquisition cost has to come back sooner. The median across all B2B SaaS sits at 15 to 18 months as of 2026, which means roughly half the market is running outside the efficient range. Top-quartile operators consistently hit under 12 months. (Sources: SaaSMag / Benchmarkit, May 2026; Optifai Pipeline Study, N=939 companies.)
For a service business or small retailer, you may not have monthly recurring revenue, but you still have a payback clock. A landscaping company that spends $250 in door-hangers and time to land a client generating $80/month of margin after labor recovers that CAC in about three months. That’s a healthy business. Know your clock, whatever form it takes.
Putting this to work? The ideas in the Canon are the foundation under the tactical playbook in Build a Complete Marketing Departmentgrab the free companion kit at mmsvegas.com/resources.
Reading the Numbers: What the CAC LTV Ratio Is Actually Telling You
Benchmarks get repeated so often they start to feel like commandments. The 3:1 threshold is real and useful, but it needs context to mean anything. As of 2026, the B2B SaaS median sits at approximately 3.2:1, with top-quartile companies operating between 4:1 and 6:1, and enterprise SaaS averaging around 4.5:1. (Foundry CRO; Optifai Pipeline Study, 2026.) Those numbers reflect SaaS-specific economics, high gross margins, recurring revenue, contractual customer relationships, so treat them as directional rather than universal.
A practical read of the zones:
- Below 1:1: You’re losing money on every customer acquired. More volume makes it worse. Stop scaling and fix the model first.
- 1:1 to 2:1: Technically positive, practically dangerous. There’s no cushion for overhead, customer service, or a bad quarter.
- 3:1 to 5:1: Room for swings in lifetime value or acquisition cost while protecting margins. Strong performance for most business models.
- Above 5:1: Probably under-investing in growth. A ratio this high is either the sign of an exceptional business with locked-in customers and strong organic referral, or a sign of timidity about spending on acquisition. Competitors willing to run at 3:1 are buying market share while you protect the number.
The benchmark caveat that actually matters: a 2.5:1 ratio with a 9-month payback period and strong net revenue retention can be a better business than a 4:1 ratio with a 36-month payback and high churn. The ratio and the payback period tell you different things, and you need both.
Industry context matters too. Enterprise tolerates a higher CAC because LTV is enormous and contracts are sticky. Product-led growth demands a low CAC because each customer is worth less individually. A boutique consulting firm and a high-volume e-commerce brand should not benchmark against each other, the ratio target stays roughly constant; the absolute dollars don’t.
Four Levers That Move the Ratio, and Which One Matters Most
The ratio is a product of four underlying variables: revenue per account, gross margin, churn, and acquisition cost. Improving any one of them moves the ratio, but the levers have different time horizons and different magnitudes of impact.
1. Reduce CAC
This is where most operators look first, because it feels like the most controllable variable. Eliminating a channel burning money at a bad ratio, or shifting budget toward organic acquisition, directly improves the math.
Referrals are the most powerful CAC reducer available to a small operator. At $141, $200 per B2B customer versus $802 for paid search, the gap translates directly into ratio improvement. A structured referral program, even something as simple as asking satisfied clients for introductions at the 90-day mark, generates a steady stream of near-zero-cost acquisitions.
Businesses with strong owned channels, SEO, content, community, offset paid CAC inflation with organic acquisition that compounds over time, unlike paid ads, which carry a flat per-acquisition cost regardless of how long you run them.
2. Raise Revenue Per Customer
Pricing, upsells, cross-sells, and bundling all lift the numerator without touching acquisition cost. This lever also has the shortest feedback loop of any LTV improvement, you can test a price increase or an add-on offer this quarter and see the math move before the quarter ends.
3. Improve Gross Margin
Often overlooked because it reads as an operations question rather than a marketing one. But gross margin sits directly inside the LTV formula, it’s a multiplier, not a footnote. A business with 80% gross margins and a 3:1 LTV:CAC ratio is in a fundamentally stronger position than one with 50% gross margins at the same ratio, because the actual dollar return per dollar spent is far higher. Renegotiating supplier costs, improving delivery efficiency, or cutting fulfillment waste all strengthen the ratio without touching a single ad.
4. Reduce Churn
This is the lever that moves the ratio the hardest, and it’s chronically underrated. Because churn sits in the denominator of the LTV formula, small reductions compound aggressively. Reducing churn from 5% to 3% can swing your LTV:CAC ratio from 2.5:1 to 4:1 without increasing acquisition costs at all.
For a service business, churn reduction means onboarding better, following up consistently, delivering results clients can see, and asking for the renewal before clients start shopping. None of that requires ad spend. All of it moves the ratio.
One important distinction: the fastest way to fix a broken ratio is usually cleaner data and better channel targeting to lower CAC, but the more durable fix is almost always retention. Discounts cut into the margin that makes LTV real. Better retention compounds it.
Where the CAC LTV Ratio Applies Beyond SaaS
The ratio was built in the SaaS world and is still talked about mostly in that context. That’s a shame, because the concept is equally powerful, and equally urgent, for any business that spends money to acquire customers and earns revenue from them over time.
Local service businesses (HVAC, plumbing, landscaping, pest control): These businesses often have high repeat rates and strong referral loops, which means LTV is much higher than it appears from a single job. A plumber who lands a client on a $180 first visit, then does $600/year in recurring work for six years, has a $3,780 gross-revenue LTV. If the business’s gross margin is 40%, that’s $1,512 in margin. What’s the CAC? If paid ads cost $500 to get that first call, the ratio is 3:1. If a referral cost $80, the ratio is nearly 19:1. Most operators in this category have no idea what those numbers are. They just run ads because competitors do.
Gyms and fitness studios: A local gym that spends $1,000 on a campaign to acquire ten new members incurs a CAC of $100 per member. If the average gross-margin-adjusted LTV is $300, the ratio is 3:1, which is strong for this category. The problem is most gyms don’t track how long members actually stay. Without that number, every marketing decision is a guess.
Professional services (law, accounting, consulting): CAC is often hidden in partner time, conference attendance, and proposal writing, none of which appears as ‘marketing spend’ on a P&L. When operators account for all of it, CAC is usually much higher than assumed. The good news is LTV is also high, and referral rates are often strong enough to pull CAC back down substantially.
E-commerce and retail: The repeat-purchase pattern determines everything. A customer who buys once and never returns has an LTV equal to that single order. Loyalty programs, email reactivation campaigns, and subscription models all exist to pull average lifespan upward, which is just ratio improvement by another name.
Where the Ratio Breaks Down
The CAC LTV ratio is a powerful diagnostic, but it’s a projection built on assumptions, and small operators should know where those assumptions get shaky.
High variance in customer tenure: If your customer base splits into ‘loyalists who stay forever’ and ‘one-timers who never come back,’ a blended LTV is almost meaningless. You need to segment, and the average will mislead you. Two businesses with an identical average LTV can have completely different economics underneath.
Long sales cycles with time-lagged CAC: Spend in Q1 often closes deals in Q2, so you need to match cohorts to the period they were acquired, not the period you spent. An operator who divides this month’s ad spend by this month’s new customers will get a distorted CAC, especially if their sales cycle is 60 to 90 days.
Early-stage businesses without enough data: If you’ve had 20 clients, you don’t have a reliable LTV estimate. You have three who stayed two years, six who churned in six months, and eleven you can’t predict yet. Building a ratio from that and making big investment decisions is premature. Get the data first, which usually means operating for at least 12 to 18 months before you trust the number enough to scale against it. As investor Tomasz Tunguz has written (tomtunguz.com), a company one or two years into sales often can’t yet accurately forecast customer lifetimes, which makes LTV projections speculative by nature.
The cohort decay problem: If you calculate a blended LTV:CAC of 3.2:1 but your most recent cohort shows 1.8:1, your headline number is hiding a deteriorating trend. This matters most when channels or pricing have changed recently, which they almost always have.
Treating LTV as revenue instead of margin: Worth repeating because it’s so common. A consulting firm billing $15,000 per client but carrying $10,000 in subcontractor and delivery costs has an LTV built on $5,000, not $15,000. Using the top-line number makes everything look better than it is, right up until cash flow tells a different story.
Common Mistakes
- Calculating CAC without running it by channel, then cutting the wrong oneA blended 3:1 ratio can mask a referral channel at 9:1 carrying a paid search channel running at 1.2:1. When operators cut ‘marketing spend’ based on blended numbers, they frequently eliminate the channel with the best ratio and double down on the worst. Before making any channel decision, segment CAC and LTV separately by source. The gap between your best and worst channel is almost always the real story.
- Treating a 30-day churn improvement as solved when it only moved annual retention from 72% to 75%Small retention gains feel minor in a monthly dashboard and look transformative inside the LTV formula. A move from 72% annual retention to 80% annual retention changes your average customer lifespan from 3.6 years to 5 years, a 39% lift in LTV. Operators who don’t model this explicitly keep under-investing in retention programs because the month-over-month change looks incremental.
- Waiting until the close of a new cohort to recalculate, then discovering a broken ratio 18 months lateTrack early cohort signals (90-day retention rate, first-month engagement) as leading indicators of LTV. If a new paid channel is bringing in customers who churn at 2x the rate of your referral base, you’ll see that at 90 days, not 18 months later. Set a quarterly calendar reminder and check your most recent two cohorts every time, not just the blended total.
- Scaling ad spend immediately after hitting 3:1, before confirming the ratio holds on the new channelA ratio built on your existing customer base doesn’t automatically transfer to a new acquisition channel. Customers from cold paid traffic behave differently than customers from referrals or organic search, they often have lower initial intent, higher churn, and different upsell rates. Run a test cohort of at least 30 to 50 new customers from the new channel and track their 90-day behavior before scaling budget against the assumed ratio.
- Calculating it once and treating it as permanentRecalculate every quarter. CAC rises as channels saturate, up roughly 60% over the past five years according to ProfitWell, and LTV shifts with pricing changes, churn trends, and customer mix. A ratio you calculated 18 months ago may no longer describe your actual business.
Operator’s Take
The ratio almost never is the problem. The problem is hiding inside one of its inputs. Figure out which one before you touch anything, the fix looks completely different depending on the answer.
Run the number honestly first. Fully-loaded CAC. Gross-margin-adjusted LTV. If you leave out partner time, event costs, or CRM subscriptions because they ‘don’t feel like marketing,’ you’re not doing unit economics, you’re doing wishful thinking on a spreadsheet. The operators who find the most useful surprises here are the ones who include their own time at a real hourly rate. Most are shocked by how high their true CAC is. Some are equally surprised to learn the economics are fine, they were just too conservative about acquisition spend because nobody had run the math.
Before you draw any conclusions, segment by channel. Your referral clients are probably sitting at 10:1 or better. Your paid search clients might be at 2:1. Those two channels belong in completely different budget conversations, and the blended number will never tell you which one to cut. This is where most operators waste money, they see a blended 3:1, feel okay, and keep running the same mix. Meanwhile the referral engine is carrying a paid channel that would be dead on arrival if anyone looked at it alone.
Here’s a specific move almost nobody makes: book a 30-minute review of your two most recent cohorts every quarter. Not blended totals, cohorts. If the newest one is running at 1.8:1 while your overall average says 3.2:1, something changed. Maybe a new ad channel brought in lower-intent buyers. Maybe a pricing change attracted a different customer who churns faster. You won’t catch that in a dashboard that shows you only the aggregate. The cohort is where the early warning lives.
Watch payback separately from the ratio. The ratio is the long game; payback is cash planning. If you’re bootstrapped and your payback is 18 months, you need reserves to float that gap, or you need channels with faster payback even if the long-run ratio looks similar. Referrals almost always win on payback, which is another reason to build them deliberately rather than just hope they happen.
If the ratio is broken, check retention before you touch the ad budget. The math is worth spelling out: if your monthly churn is 5% and you bring it to 3%, your average customer lifespan goes from 20 months to 33 months, a 65% lift in LTV with zero additional ad spend. That’s not a rounding error. That’s often the difference between a ratio that barely clears 2:1 and one that crosses 3:1. Fixing acquisition when retention is leaking is like bailing out the boat without plugging the hole.
One more thing, aimed specifically at operators whose ratio is already strong: if you’re above 3:1 with a payback under 12 months, the right question isn’t ‘how do I protect this?’ It’s ‘what would it take to deliberately spend more?’ Each additional dollar you put in returns three. The businesses that stay smaller than they could aren’t always short on ambition. Sometimes they just never ran that question.
Used in
- ✓ Build a Complete Marketing Department
Used to set the acquisition budget ceiling, operators calculate their ratio to determine how much they can afford to spend per new customer before the economics break. - ✓ The Missing Manual for FunnelKit
Used to evaluate whether individual funnel campaigns are producing customers at a cost that justifies the contribution margin they return over time. - ✓ The Missing Manual for Make
Used to automate the data collection and periodic recalculation of CAC and LTV across channels, so the ratio stays current without manual effort each quarter.
FAQ
What is a good CAC LTV ratio for a small business?
3:1 is the widely cited baseline, meaning the gross-margin-adjusted lifetime value of a customer is at least three times what it cost to acquire them. Below 3:1, the economics are thin. Above 5:1, you may be under-investing in growth. The right number also depends on your payback period: a 3:1 ratio with a 6-month payback is a stronger position than a 4:1 ratio with a 30-month payback.
How do I calculate CAC for a service business that doesn’t run paid ads?
Add up everything you spend on acquiring new clients: your time in sales conversations and proposals (at a reasonable hourly rate), any networking or event costs, referral gifts, website costs attributable to lead generation, and any third-party tools. Divide by the number of new clients acquired in the same period. Most service operators are surprised how high this number is once they include their own time.
Should I use revenue or profit to calculate LTV?
Always use gross profit, revenue minus the direct costs of delivering the product or service. Using top-line revenue overstates LTV and makes your economics look stronger than they are. The ratio is only useful as a decision tool when it reflects the real margin each customer contributes.
What’s the difference between the CAC LTV ratio and the CAC payback period?
The ratio is a long-horizon measure of overall profitability per customer. The payback period measures how many months it takes a customer’s contribution margin to recover what you spent to acquire them. Both matter: a great ratio with a long payback can still create cash flow problems for a bootstrapped operator.
What’s the fastest way to improve a low CAC LTV ratio?
Retention. Because churn sits in the denominator of the LTV formula, even a small improvement in how long customers stay creates a large lift in LTV. Reducing monthly churn by two percentage points can move a 2.5:1 ratio to 4:1 without touching acquisition spend. Fix why customers leave before pouring more budget into bringing new ones in.
Is this metric only relevant for subscription businesses?
No. Any business where customers make repeat purchases over time has a meaningful LTV, gyms, landscaping companies, accountants, retailers with loyalty programs. The formula looks slightly different (average order × purchase frequency × tenure instead of ARPU ÷ churn), but the ratio and its implications are identical.
Further reading
- ‘SaaS Metrics 2.0’ by David Skok (ForEntrepreneurs.com), the essay that formalized the 3:1 benchmark and the CAC/LTV/payback framework for subscription businesses; the clearest original source for the SaaS application of these concepts.
- Bessemer Venture Partners, Atlas Cloud Framework (bvp.com/atlas), the framework that set CAC payback targets by customer segment and remains a standard reference point for SaaS operators and investors.
- Lech Kaniuk, The Two Numbers That Build or Break Every Business (LTVCACbook.com), extends the LTV:CAC framework beyond SaaS, grounded in the author’s firsthand experience scaling and exiting marketplace businesses including PizzaPortal (acquired by Delivery Hero) and SunRoof.
- Foundry CRO, ‘LTV:CAC Ratio Benchmarks 2026’ (foundrycro.com), current segment-level benchmarks with a breakdown by business model and capital structure; a useful calibration check for the numbers cited on this page.
- Customer Lifetime Value Explained (Operator’s Canon), the detailed companion page on calculating and applying LTV before plugging it into the ratio.
- Scientific Advertising Explained (Operator’s Canon), Claude Hopkins’ foundational argument that every marketing dollar should be measurable and accountable; the philosophical ancestor of unit economics thinking.
Sources:
David Skok, ‘SaaS Metrics 2.0,’ ForEntrepreneurs / Matrix Partners, foundational framework for LTV:CAC and payback period, published circa 2009 to 2010. | Bessemer Venture Partners, Atlas Cloud Framework (bvp.com/atlas), segment payback targets. | Lech Kaniuk, The Two Numbers That Build or Break Every BusinessLTVCACbook.com, serial entrepreneur, co-founder of PizzaPortal (acquired by Delivery Hero) and SunRoof. | Foundry CRO, ‘LTV:CAC Ratio Benchmarks 2026’ (foundrycro.com, May 2026), B2B SaaS median of 3.2:1 and segment breakdown. | Optifai Pipeline Study, ‘B2B SaaS LTV Benchmarks,’ 2026, N=939 companies, median LTV:CAC of 3.2:1. | SaaSMag / Benchmarkit, ‘CAC Payback Period: The New SaaS Growth Gauge in 2026’ (May 2026), median payback of 15 to 18 months; top-quartile under 12. | Aleph × Benchmarkit, ‘2026 SaaS & AI Performance Benchmarks’ (July 2026), median B2B SaaS payback of 16 months across 342 companies. | Data-Mania / Lillian Pierson, ‘B2B Tech Startup CAC Benchmarks 2026’ (data-mania.com, July 2026), paid search $802 per customer vs. referrals $141, $200. | ProfitWell (cited in multiple sources, 2026), CAC up roughly 60% over five years. | Tomasz Tunguz, ‘The False Confidence of the LTV/CAC Ratio for Early Stage SaaS Startups’ (tomtunguz.com), caution on LTV projections at early stage. | GrowthSpree, ‘B2B SaaS LTV:CAC Ratio Guide 2026’ (April 2026). | SaaSHero, ‘Optimal CAC to LTV Ratio for B2B SaaS: 2026 Benchmarks’ (June 2026). | Wall Street Prep, ‘LTV/CAC Ratio: SaaS Formula + Calculator.’ | MetricHQ, ‘Lifetime Value to Cost of Acquisition Ratio.’
Brian Kasday spent forty years in direct-response marketing before rebuilding the whole operation as a one-person shop. He writes The Operator’s Library, including “Build a Complete Marketing Department”, for operators who’d rather build it themselves than wait on someone else.
Build the department these ideas describethe free companion kit: mmsvegas.com/resources.
More The Operator's Canon guides
Free · Operator Toolkit
Want the tools, not just the guide?
Get the free operator toolkit — templates and checklists for the systems you actually run, plus a note when this guide changes.
Get the free toolkit →