
The 30-second answer
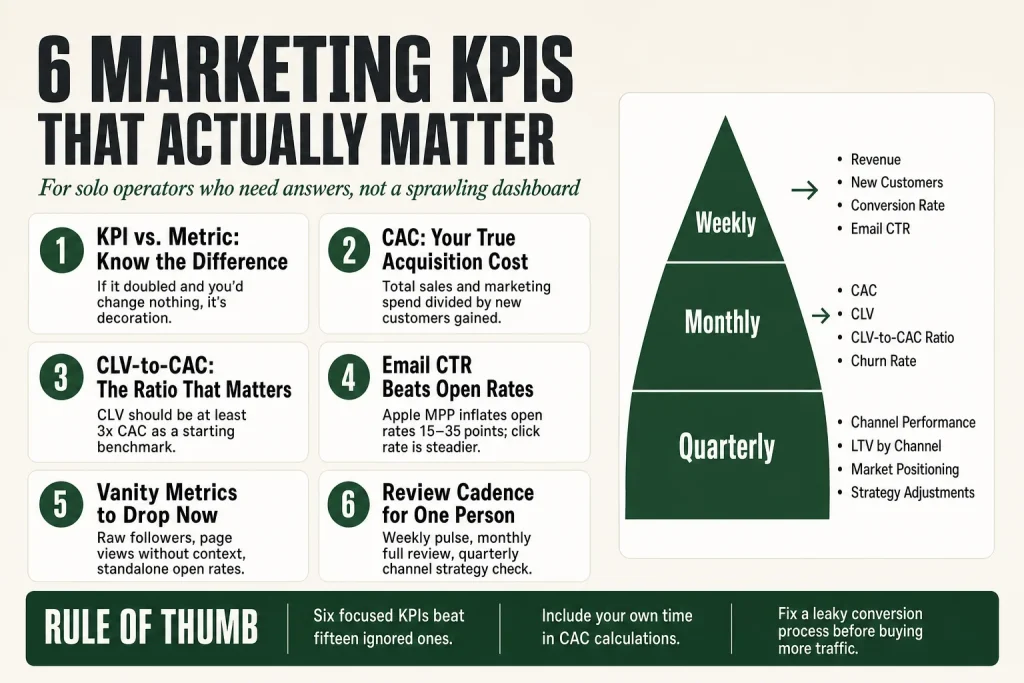
- A KPI is not just any metric. It’s a number tied to a specific goal that triggers a decision when it moves. If you’d change nothing when it doubles, it’s decoration, not a KPI.
- Track six core numbers: Customer Acquisition Cost (CAC), Customer Lifetime Value (CLV), lead-to-customer conversion rate, channel-level traffic with source attribution, email click-through rate, and revenue per campaign or channel.
- CAC formula: Total sales and marketing spend divided by new customers gained in the same period.
- CLV formula: Average order value multiplied by purchase frequency multiplied by customer lifespan in years.
- Healthy ratio: CLV should be at least 3x your CAC as a commonly cited starting benchmark. The right ratio for your business depends on your margins, sales cycle, and growth stage.
- Review cadence: Weekly pulse on email and traffic; monthly review of CAC, CLV, and conversion rate; quarterly look at channel mix.
- Vanity metrics to drop: Raw social followers, page views without context, and open rates inflated by Apple Mail Privacy Protection.
Take this fix into your next scenario. The free Builder’s Companion Kit collects the checklists and templates that pair with this guide — so next time, you start from a template, not a blank page. Grab it free →
- The Difference Between a KPI and a Metric (It’s Not Pedantic)
- The Six Marketing KPIs for Small Business That Actually Matter
- Vanity Metrics: What to Stop Tracking
- Worked Example: Running the Core Marketing KPIs for Small Business on a Service Business
- The Review Cadence That Fits a One-Person Operation
- How to Set Targets When You Have No Benchmark History
- FAQ
Marketing KPIs for small business are not a list of thirty numbers you review once a quarter and promptly ignore. They are the six to eight metrics that, if any one of them moves in the wrong direction, you know exactly where to look and what to fix. The problem most solo operators run into is the opposite: they track everything their platform will export, fill a spreadsheet, and still can’t answer the one question that matters, which is whether their marketing is making them money. This article gives you the short list, the formulas, a worked example, and the review cadence that fits a one-person operation.
The Difference Between a KPI and a Metric (It’s Not Pedantic)
A metric is any number you can measure. A KPI is a metric tied to a goal that actually decides success. Website sessions can be a metric every day and a KPI only when growing sessions is the specific goal you’re judging right now.
Here’s the practical test: if a number doubled tomorrow and you would change nothing about how you work, it’s not a KPI. It’s decoration. A real KPI makes you do something differently when it moves.
The reason this matters for a solo operator is bandwidth. You have one set of hands. Tracking fifteen numbers means you track none of them properly, and your review becomes a ritual nobody learns from. Six focused numbers, reviewed on a set cadence, beat a sprawling dashboard every time.
Your KPIs also need to connect to a goal. Before you pick a single number, name the goal it serves. “Get more traffic” is not a goal. “Reduce CAC below $120 this quarter by shifting budget from paid to content” is a goal. The KPI is CAC. The number tells you whether the strategy is working.
The Six Marketing KPIs for Small Business That Actually Matter
These are the numbers a solo operator should own. They cover acquisition cost, customer value, conversion efficiency, channel performance, and email engagement. Together, they answer the only question worth asking: is marketing making more money than it costs?
1. Customer Acquisition Cost (CAC)
CAC is the total you spend on sales and marketing divided by the number of new customers you gained in the same period. The formula is straightforward: CAC = Total Sales and Marketing Costs divided by New Customers Gained.
The part most small businesses get wrong is what counts as “total costs.” It includes ad spend, your own time billed at a reasonable hourly rate, software subscriptions, any freelance help, and tools you use to run campaigns. If you only count ad spend, your CAC looks artificially low and you make bad channel decisions.
Track CAC monthly. If it’s rising and revenue per customer is flat, your marketing is getting less efficient, not more.
2. Customer Lifetime Value (CLV)
CLV is the total revenue a single customer brings over the whole relationship. The standard formula: CLV = Average Order Value multiplied by Purchase Frequency multiplied by Customer Lifespan in years. For a profit-focused view, swap average order value for average gross profit per order.
The ratio that matters is CLV to CAC. A 3:1 ratio is the benchmark most commonly cited: you earn three dollars in lifetime value for every dollar spent acquiring the customer. Treat it as a directional starting point, not a universal rule that applies equally to every business model. The right ratio depends on your margins, sales cycle, capital intensity, and growth stage. A lean service business with almost no overhead may run sustainably well above 5:1 and that’s fine. A product business with high fulfillment costs may need to work harder to clear 3:1. Below 3:1 generally signals that acquisition is expensive relative to what you’re getting back. Above 5:1 can be a flag that you’re underinvesting in acquisition, though context matters. Use the ratio to spot trends in your own numbers over time, not to grade yourself against a generic standard.
CLV is also the number that reframes your pricing and retention decisions. If a client is worth $8,400 over three years, you can afford to invest more in onboarding, follow-up, and retention. If you only see the first invoice, you undervalue the relationship. For a deeper look at keeping customers once you have them, see how to reduce customer churn as a small business.
3. Lead-to-Customer Conversion Rate
This is the percentage of leads that turn into paying customers. Divide the number of new customers by the number of leads in the same period, then multiply by 100. Across B2B, a solid inbound lead-to-customer rate is often cited in the 8 to 12 percent range, with high-intent channels like referrals reaching 15 to 20 percent. These figures vary considerably by industry and offer type, so use them as a rough orientation, not a firm target.
If your rate is under 5 percent on inbound leads, the bottleneck is usually speed-to-lead or qualification, not traffic quality. More leads won’t fix a leaky conversion process. Fix the process first.
Split this number by source. A referral lead converts at a very different rate than a cold organic search visitor. Blending them hides where you’re strong and where you’re bleeding.
4. Channel-Level Traffic with Source Attribution
You need to know which channel sends visitors who actually convert, not just which channel sends the most bodies. In GA4, the Traffic Acquisition report (found at Reports, then Acquisition, then Traffic Acquisition) shows you sessions, engagement rate, and key events by channel, including organic search, direct, email, paid, referral, and social.
A note on terminology that trips people up: GA4 renamed what it previously called “conversions” to “key events” in March 2024. That’s the label you’ll see throughout the GA4 interface today, including in the Traffic Acquisition report. The word “conversion” in GA4 now refers specifically to key events that have been imported into a linked Google Ads account for campaign measurement and bidding. If you don’t run Google Ads, you won’t see conversions in GA4 at all. You’ll work entirely with key events. GA4 also has an Acquisition Overview report at the same navigation path that gives a higher-level summary across channels. The Traffic Acquisition report is where you get the per-channel detail you need.
Without clean UTM parameters on every campaign link, this data is fragmented and unreliable. If your GA4 shows a large “(direct) / (none)” bucket, much of your campaign traffic is mislabeled. Fix that first, then read the channel report. For a clean system, see the UTM naming convention guide.
5. Email Click-Through Rate
Open rates are noisy. Since Apple Mail Privacy Protection began pre-loading tracking pixels, open rate figures from most platforms are significantly inflated. Studies tracking the MPP rollout have measured inflation in the range of 15 to 35 percentage points depending on how much of a list uses Apple Mail. The click-through rate (CTR), which is the percentage of recipients who click a link in your email, is the steadier signal. Across platforms, a click rate of roughly 2 percent of recipients is typical for broadcast campaigns, with automated flows performing considerably higher.
Judge your subject line and preview text by open rate trends over time on the same list, not against inflated industry averages. Judge your body copy and offer by click rate. If opens are solid and clicks are low, the problem is inside the email, not the subject line.
For open rate fixes, the low email open rates fix list walks through the prioritized causes. For cadence decisions that affect both numbers, see how often to email your list.
6. Revenue Per Channel or Campaign
This is the one that ties everything together. For each active marketing channel, what revenue did it directly generate or influence this period? Pair this with your CAC by channel and you have a real picture of where to put your next dollar.
You don’t need complex attribution modeling. For a solo operator, last-click attribution tracked through consistent UTM tags and a simple spreadsheet is enough to make better decisions than no attribution at all. Connect this number to your budget review. For the budget side of that equation, see how to set a marketing budget for small business.
Vanity Metrics: What to Stop Tracking
Every number below is real and measurable. None of them are KPIs for a solo operator, because none of them tell you whether marketing is working.
- Raw social media followers. Follower count is a rough proxy for awareness at best. An engaged list of 400 people who buy beats 40,000 passive followers every time. Track engagement rate and click-through on social posts if social is a real channel for you.
- Page views without context. A spike in page views after a press mention looks great in a report. It means nothing if bounce rate is 95 percent and no one converts. Pair any traffic metric with an engagement or conversion metric.
- Email open rates as a standalone. As noted above, platform-reported open rates are inflated by Apple’s Mail Privacy Protection. Use it as a directional trend on the same list over time, not as a benchmark against industry averages.
- Social reach and impressions. Reach tells you how many feeds your content appeared in. It doesn’t tell you whether anyone acted on it. Save your attention for click-through and conversion data.
- Keyword ranking as a vanity number. Ranking for a keyword matters only if that keyword sends traffic that converts. Pair rankings with organic traffic data and conversion events, not ranking position alone.
The question to ask about any metric: “If this number doubled tomorrow, what would I do differently?” If the answer is “nothing,” remove it from your dashboard.
Worked Example: Running the Core Marketing KPIs for Small Business on a Service Business
Here’s how a solo consultant or service provider might run through these six numbers in a monthly review.
The business: A freelance brand strategist. Monthly marketing spend: $800 (content tools, email platform, occasional boosted post). New clients this month: 4.
CAC: $800 divided by 4 = $200 per new client. That’s the floor. Add the owner’s 6 hours of marketing time at $150 per hour and the real CAC is ($800 + $900) divided by 4 = $425 per client.
CLV: Average project value is $3,200. Clients typically return for two projects and refer one additional client over three years. Simple CLV: $3,200 times 2 = $6,400. With the referral factored in as extra lifetime value, true CLV sits closer to $9,600. CLV-to-CAC ratio: $9,600 divided by $425 = 22.6x. This is a high ratio, common in referral-heavy service businesses with low overhead. It doesn’t mean anything is wrong. It signals room to invest more in acquisition if lead volume is the bottleneck. In this type of business, the ratio is less useful as a benchmark and more useful as a signal: if it drops sharply, find out why.
Lead-to-customer conversion rate: 18 leads came in this month, 4 became clients. Conversion rate: 4 divided by 18, multiplied by 100 = 22.2 percent. That’s strong for this business type. If this number dropped to 8 percent next month with the same lead volume, the first question is whether lead quality changed, not whether to run more ads.
Channel traffic: GA4 Traffic Acquisition report shows organic search sent 340 sessions at a 4.1 percent key-event rate. Email sent 90 sessions at 8.9 percent. Referral sent 30 sessions at 33 percent. Referral converts at the highest rate by a wide margin. The operator decides to formalize the referral process. See referral program for service business for how to build that out.
Email CTR: Last campaign: 2.8 percent of recipients clicked. That’s above the typical 2 percent broadcast benchmark. The sequence driving the most clicks is the onboarding email sent after a discovery call, which has a 9.4 percent CTR. That email does more selling than any campaign. The operator decides to write a second email in that sequence.
Revenue per channel: Organic search: $12,800 this month (4 clients, all found via search). Email: $0 in direct attribution, but it influenced 3 of those 4 closes based on reply data. Referral: $3,200 (one client). This shapes where the next quarter’s effort goes.
The whole review took 25 minutes. That’s the point.
The Review Cadence That Fits a One-Person Operation
Reviewing daily is noise. Reviewing quarterly is too slow to catch problems before they compound. For a solo operator, a three-tier cadence works well.
Weekly (5 minutes)
Pulse check only. Look at email campaign sends and CTR, and check that traffic is not dramatically down or up without an obvious reason. If something looks off, flag it for the monthly review. Don’t try to diagnose it mid-week.
Monthly (25 to 40 minutes)
This is the core review. Calculate CAC for the month. Check CLV-to-CAC ratio. Review conversion rate by source. Pull the GA4 Traffic Acquisition report (Reports, then Acquisition, then Traffic Acquisition) and look at which channel sent the most converting traffic. Review email CTR for all sends. Note what changed and why, even if you’re guessing. Write it down. Patterns only emerge if you record context, not just numbers.
Pair this review with your marketing calendar so you can connect performance to specific campaigns and timing.
Quarterly (60 to 90 minutes)
Pull back to the strategic view. Is your channel mix shifting in the right direction? Has CAC trended up or down over three months? Is CLV growing because retention is improving? This is also when you decide whether a channel deserves more budget or less. For a structured way to assess everything at once, the small business marketing audit gives you a one-operator framework.
One honest caveat: these numbers are only as clean as your tracking setup. If UTMs are inconsistent, if GA4 key events aren’t firing correctly, or if you’re not separating new customers from returning ones in your revenue reporting, your KPIs will mislead you. Spend an afternoon getting the infrastructure right before trusting the output.
How to Set Targets When You Have No Benchmark History
Most solo operators skip setting targets because they don’t have enough historical data to know what “good” looks like for their business. The fix is to start with direction, not precision.
In your first quarter of tracking, your only target is to establish a baseline. Write down what your CAC, CLV, conversion rate, and email CTR actually are, without judgment. That baseline becomes the benchmark you improve against.
In quarter two, set directional targets: CAC down 10 percent, conversion rate up 2 points, email CTR above last quarter’s average. These are not arbitrary. They’re based on one specific change you’re making, like improving the follow-up sequence or adding a lead magnet to organic traffic.
Industry benchmarks are useful as a sanity check, not as your primary target. If your email CTR is 0.4 percent and the industry average is around 2 percent, you have a real problem worth investigating. If you’re at 2.1 percent and want to reach 2.5 percent, your own trend line is the right comparison.
For building the underlying systems that generate clean data, the simple CRM workflow guide shows how to track leads and clients without a sales team, so your conversion rate numbers are actually based on complete data rather than memory.
FAQ
what are the most important marketing KPIs for a small business
Customer Acquisition Cost, Customer Lifetime Value, lead-to-customer conversion rate, channel-level traffic with source attribution, email click-through rate, and revenue per channel or campaign. These six connect marketing activity directly to revenue. Everything else is secondary until these are stable and improving.
how do I calculate customer acquisition cost for my small business
Divide your total sales and marketing costs for a period by the number of new customers gained in that same period. Include ad spend, software costs, your own time at a fair hourly rate, and any freelance help. Many small business owners undercount because they leave out their own time.
what is a good CLV to CAC ratio for a small business
A ratio of 3:1 is the benchmark most commonly cited: you earn three dollars in customer lifetime value for every dollar spent acquiring a customer. Treat it as a directional starting point, not a universal standard. The right ratio varies by business model, margin structure, and growth stage. Below 3:1 generally signals that acquisition is expensive relative to what you’re getting back. Above 5:1 can mean you’re underinvesting in acquisition, though lean service businesses often run sustainably above that level. Track your own trend over time. The ratio is most useful when it moves, not when it sits at a fixed target.
should I track email open rates as a KPI
Treat open rates as a directional trend on your own list over time, not as a benchmark against industry figures. Apple Mail Privacy Protection inflates platform-reported open rates significantly, with studies measuring the effect in the range of 15 to 35 percentage points depending on your audience’s email client mix. Click-through rate, which measures the percentage of recipients who actually click a link, is the more reliable signal for whether your emails are working.
how often should a solo operator review marketing KPIs
A three-tier cadence works: a quick weekly pulse check on email CTR and traffic to catch anything dramatically off, a full monthly review of all six core KPIs taking 25 to 40 minutes, and a quarterly strategic review of channel mix and trends. Daily checking creates noise, not insight.
what is a good lead to customer conversion rate for a small business
For inbound leads, a rate in the 8 to 12 percent range is often cited for B2B businesses, with high-intent channels like referrals reaching 15 to 20 percent. These figures vary by industry, offer type, and lead source, so use them as orientation rather than a firm target. If your rate is under 5 percent on inbound traffic, the usual culprit is speed-to-lead or qualification gaps, not traffic volume. More leads won’t fix a leaky conversion process.
Sources:
- Constant Contact, “A Small Business Guide to Marketing KPIs” (October 2026)
- Amplitude, “Customer Acquisition Cost Formula” (verified October 2026): CAC = Total Marketing and Sales Costs divided by New Customers Acquired
- Wisernotify, “Customer Lifetime Value: Formula and 5 Examples” (2026): CLV = Average Order Value times Purchase Frequency times Customer Lifespan
- Factors.ai, “Customer Acquisition Cost: Formula, Benchmarks and Tips” (2026): 3:1 CLV-to-CAC ratio cited as a common starting benchmark, not a universal standard; real-world ratios vary between 2.1 and 6 depending on business model and stage
- Lemlist, “Lead Conversion Rate: Why 2.9% Is the B2B Median” (2026), citing First Page Sage 2026 analysis
- Numriq, “B2B Conversion Rate Benchmarks 2026”: inbound lead-to-customer 8 to 12 percent across most industries (directional benchmark)
- Google Analytics Help, “GA4 Traffic Acquisition Report” (official documentation, verified October 2026): navigation path confirmed as Reports, then Acquisition, then Traffic Acquisition
- Google Analytics Help / multiple corroborating sources, “Conversions vs. key events in Google Analytics” (verified October 2026): GA4 renamed “conversions” to “key events” in March 2024; confirmed by Search Influence (April 2024), KP Playbook (March 21, 2024), Optimizesmart, Metricowl, and others; “key events” is now the label throughout the GA4 interface for important actions you mark; the word “conversion” in GA4 now refers specifically to key events imported into a linked Google Ads account for campaign measurement and bidding; if you do not run Google Ads, you work exclusively with key events in GA4
- Brevo, “Email Marketing Benchmarks 2026”: average CTR 2.27 percent excluding Apple MPP inflation
- Klaviyo, “2026 Email Benchmarks”: broadcast campaign click rate 1.69 percent; automated flow click rate 5.58 percent
- Bebop.ai, “Email Open Rate Benchmarks 2026”: click rate 2.09 to 2.62 percent is the steadier benchmark across major platforms
- Nordlys, “Marketing KPI Examples for Small Business” (2026): six-number framework for small business KPI tracking
- Omeda, “Impact of Apple Mail Privacy Protection” (multiple studies): MPP inflation measured at 15 to 35 percentage points on senders with significant Apple Mail audiences
- Hummingdeck, “What’s a Good Cold Email Open Rate in 2026?”: Omeda analysis puts MPP inflation effect at 15 to 35 percentage points
- Digital Applied, “GA4 Dimensions and Metrics: Complete 2026 Reference”: GA4 renamed conversions to key events in the UI (March 2024)
Brian Kasday spent forty years in direct-response marketing before rebuilding the whole operation as a one-person shop. He writes The Operator’s Library — including “Build a Complete Marketing Department” — for operators who’d rather build it themselves than wait on someone else.
Get the Builder’s Companion Kit — the free checklists and templates that pair with this guide: mmsvegas.com/resources.
This guide handles one marketing job. Build a Complete Marketing Department builds the whole department. See the manual →
More Marketing guides
Free · Marketing Operator Toolkit
Running marketing on your own?
Get the free toolkit — the templates and the expensive mistakes behind a one-person marketing department, plus a note when this guide changes.
Get the free toolkit →