
Last updated: August 2026
A service blueprint is the tool that shows you, on one page, exactly how your business produces the customer experience it promises. By the end of this guide, you’ll be able to draw a working blueprint for your most important service, identify the three or four backstage processes most likely to quietly kill your customer relationships, and know what to fix first.
Here’s what makes it worth your time: most operators manage the customer experience the way people manage their health, reacting to symptoms rather than understanding causes. A customer says onboarding felt slow. A client ghosts after month two. A five-star job still ends with an awkward, forgettable handoff. The frontstage looks fine. The root cause is always somewhere backstage, in a handoff nobody owns, a system that wasn’t built to talk to another system, or a step that three different employees do three different ways because nobody ever wrote it down.
A service blueprint makes the backstage visible. Not as a process manual gathering dust in a shared drive, but as a live diagnostic tool that connects every moment of the customer experience to the specific people, processes, and systems responsible for producing it. When something goes wrong for a customer, the blueprint tells you which layer to look at and what kind of fix is actually needed.
The idea in 30 seconds
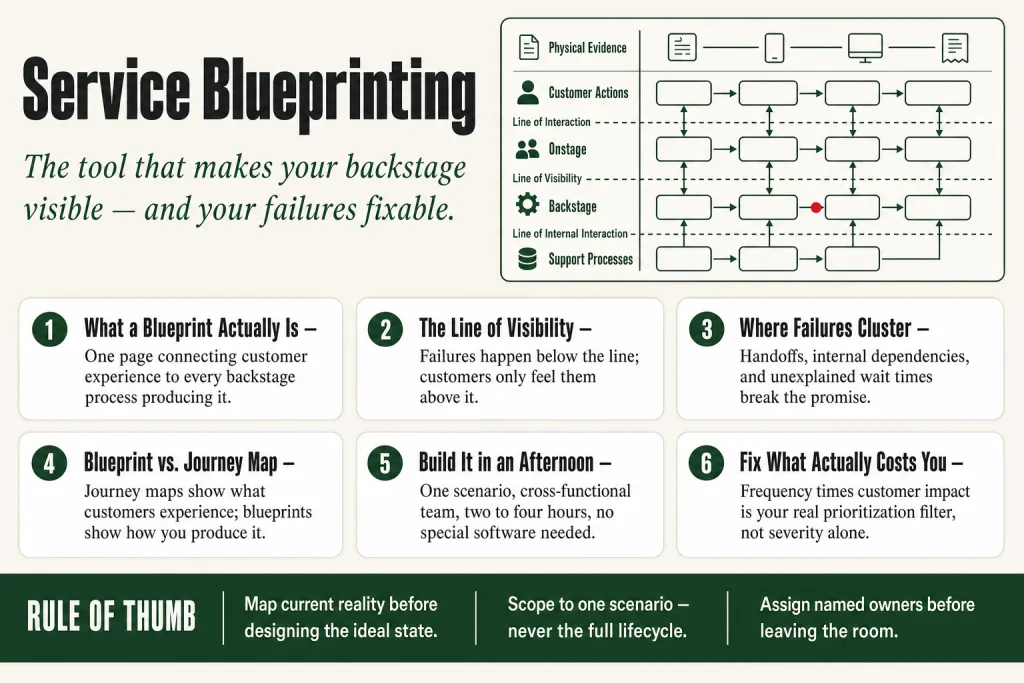
- A service blueprint is a layered diagram that connects what customers see and do to the backstage processes, people, systems, and handoffs that make it happen.
- The defining feature is the line of visibilitya horizontal boundary separating everything the customer perceives (frontstage) from everything they don’t (backstage).
- Most service failures originate below the line of visibility, in handoffs, dependencies, and support processes the customer never sees but always feels.
- It differs from a customer journey map: journey maps document what the customer experiences; a service blueprint shows how the business produces that experience.
- The primary payoff is finding fail pointsspecific moments where the backstage reliably breaks the frontstage, and redesigning them before a customer complains.
- Done with the right people in the room (not just one department), a blueprint is one of the fastest ways to align operations, marketing, and delivery around a shared picture of reality.
Where the Service Blueprint Came From
G. Lynn Shostack, then a senior vice president at Bankers Trust, introduced the service blueprint in a 1984 Harvard Business Review article, Designing Services That Deliver. Her frustration was practical: services had no equivalent of a product blueprint. Products had tolerances and measurable standards. Services had training manuals and hope.
Her fix was a two-dimensional flowchart divided by a line of visibilityabove it, what the customer sees; below it, the backstage that makes the experience possible. The original example was a shoe-shine stand with a standard execution time of two minutes and a customer tolerance of up to five, with fail points marked on the map. Simple service, but the structure she established holds four decades later.
The model reached its modern five-layer form when Mary Jo Bitner, Amy L. Ostrom, and Felicia N. Morgan published a refinement in the California Management Review in 2008. They formalized customer actions, onstage employee actions, backstage employee actions, support processes, and physical evidence as distinct swimlanes, and demonstrated the technique across industries well beyond banking. That’s the version practitioners use today.
The Anatomy of a Service Blueprint
The structure is simpler than it looks. A blueprint reads left to right, following a specific customer scenario across time. Horizontally, it has swimlanes, parallel rows, each representing a different layer of the service. Three dashed lines divide those layers and do most of the conceptual work.
The Three Lines
The line of interaction marks direct contact between the customer and the organization. Every time a vertical connection crosses this line, a service encounter occurs, a moment when the customer judges what they’re getting. These are your touchpoints: the greeting, the estimate email, the handoff call, the delivery confirmation.
The line of visibility is the defining feature of the whole method. Everything above it is visible to the customer. Everything below it is not. A doctor conducting an exam operates above the line; a doctor dictating notes into an EHR that gets filed backstage operates below it. A restaurant server taking an order is above the line; the kitchen expediter routing that order to four stations is below it. The line of visibility explains why customer experience problems are so hard to diagnose: the failure happens below the line, but the customer only feels it above.
The line of internal interaction sits lower still, separating the employees who directly support customer-facing work from the deeper support systems, software, third-party vendors, compliance processes, finance, that enable the whole operation.
The Five Layers
Working from top to bottom, the five swimlanes are:
- Physical evidencethe tangible signals the customer encounters at each step: the website, the proposal PDF, the welcome kit, the invoice, the parking lot. Physical evidence shapes perception before anyone says a word.
- Customer actionswhat the customer does, step by step. This row is built from actual customer behavior, not from how you’d like customers to behave. It anchors everything else.
- Onstage (frontstage) employee actionswhat your customer-facing people do that the customer can see and hear: answering questions, delivering a service, handling a complaint.
- Backstage employee actionswhat your people do to support the frontstage that the customer never sees: preparing for the meeting, processing the order, updating the account, communicating with another department.
- Support processesthe systems, tools, and third-party dependencies that make everything above possible: the CRM, the scheduling software, the payment gateway, the subcontractor, the inventory feed.
Conventions aren’t rigid. Some blueprints add a wait-time row, or mark fail points with a red symbol, or add a policy row that records what employees are actually allowed to do at each step. The structure flexes. What doesn’t flex is the insistence on mapping all five layers for the same customer scenario simultaneously, that’s what makes the dependencies between them visible.
The Moment That Makes It Worth Doing
Every practitioner who runs a blueprinting workshop tells a version of the same story: there’s a moment, usually when the backstage rows start filling in, when someone in the room says ‘Wait, I didn’t know that happened.’ A customer-facing team member sees, for the first time, how many internal loops their ‘simple’ request triggers backstage. An operations person realizes that a step they consider routine creates a three-day delay the customer experiences as silence. That moment of mutual visibility is the actual product of a blueprinting session. The diagram is just its record.
Service Blueprint vs. Customer Journey Map: Why You Need Both
These two tools get conflated constantly, and it costs operators real insight when that happens. They’re related but they answer different questions.
A customer journey map tells the story from the customer’s perspective, their emotions, their expectations, where they feel friction, what they actually need. It’s built from customer research. It lives in the empathy layer. You use it to understand what the customer experiences and where the experience breaks down for them.
A service blueprint answers a different question: how does the organization produce that experience? It takes the customer’s journey as its spine, then adds every backstage process, employee action, system dependency, and handoff that supports each moment. Journey maps illuminate what customers go through. Blueprints expose how internal teams and systems either deliver or undermine it.
The relationship is sequential. You almost always want the journey map first, it gives you the customer-grounded scenario that anchors the blueprint. Then the blueprint adds operational depth. Together they give you end-to-end visibility: the journey map shows what matters to the customer; the blueprint shows what has to change operationally to improve it.
A common mistake is treating them as interchangeable. They’re not. Running a blueprint without a solid customer-grounded journey first means you risk organizing the blueprint around your internal processes rather than around the customer’s actual experience. The customer actions row becomes a reflection of your org chart, not of what a real customer does. That’s how you build a beautiful diagram that misses the actual problem.
Short version: use a journey map when you want to understand or empathize. Use a service blueprint when you know what needs to change and want to figure out how to make it happen operationally.
Putting this to work? The ideas in the Canon are the foundation under the tactical playbook in Build a Complete Marketing Department — grab the free companion kit at mmsvegas.com/resources.
Fail Points, Handoffs, and the Real Source of Service Failure
The most valuable thing a service blueprint does is surface fail points, specific moments in the backstage where the process reliably breaks down and the customer eventually feels it. Shostack marked these on her original blueprints. The 2008 Bitner, Ostrom & Morgan framework formalized them. They’re still the primary reason to build one.
Fail points cluster in predictable places. Handoffs are the most common culprit: the moment when responsibility for the customer moves from one person, team, or system to another. Sales hands off to onboarding. Onboarding hands off to account management. The estimate gets sent to the install team. The support ticket escalates to engineering. Every handoff is a seam, and seams are where information gets lost, context disappears, and the customer starts feeling like they have to re-explain themselves from scratch.
There’s also a pattern that shows up repeatedly in blueprinting workshops: for every backstage step involving a handoff between departments, there’s almost always an informal documentation step, an email thread, a sticky note, a Slack message, that never appears in the official process but can account for a significant chunk of actual processing time. Nobody documents these micro-steps because they feel embarrassing. The blueprint surfaces them because someone in the room eventually says, ‘Oh, and then I also have to…’
The second cluster is at the line of internal interaction, where your customer-facing people depend on systems or departments they don’t control. Your sales rep promises a two-day turnaround. Your fulfillment team is running on a three-day cycle and nobody told sales. Your onboarding specialist needs access to a database that requires IT approval. The frontstage staff do everything right. The backstage breaks the promise, and the customer chalks it up to the person they spoke to.
The third cluster is at wait points. Blueprints let you mark how long each step takes, and the gaps between steps where nobody is actively working but the customer is sitting in silence, wondering. Long waits that go unexplained erode trust faster than almost anything else. The blueprint makes wait times visible in a way that no anecdotal feedback ever quite captures.
Once you can see where the fail points are, you can start asking the right question: is this a people problem, a process problem, or a system problem? They need different fixes. A people problem means training, accountability, or the wrong person in the role. A process problem means the sequence is wrong or the steps aren’t standardized. A system problem means the tools aren’t talking to each other, or a third-party dependency is unreliable. Conflating these three produces expensive, ineffective fixes. The blueprint separates them.
How to Actually Build a Service Blueprint
You don’t need software, a consultant, or a two-day offsite. You need a clear scenario, the right people in the room, and a couple of hours. Here’s how to approach it without turning it into a project that never ships.
Choose One Scenario
Don’t try to blueprint your entire business at once. Pick one journey, ideally one that’s causing friction, that you’re about to redesign, or that represents your most common customer experience. ‘Customer signs up and reaches first value’ is a reasonable scope. ‘Customer lifecycle’ is not.
Get Cross-Functional People in the Room
This is the step most operators skip, and it’s the one that makes the difference. A blueprint built by one person, or by a team that only knows one layer, will have blind spots the size of your actual problems. You need someone from every team that touches the scenario: whoever handles the customer-facing moment, whoever does the backstage work behind it, and whoever owns the systems that support both. Four or five people with different vantage points is ideal. More than eight and you spend the session managing the room instead of mapping.
Build Customer Actions First
Start from the customer’s perspective, not from your process documentation. What does a real customer actually do, step by step, from the moment they enter this scenario to the moment they exit it? Build this row from research or direct observation, not from how you’d like them to behave. Every other row in the blueprint hangs off this one.
Add the Frontstage, Then Backstage, Then Support
Work downward through the swimlanes, filling each layer in sequence. For every customer action, ask: what does a customer-facing employee do here that the customer can see? Then: what does that same employee (or another) do backstage to make it happen? Then: what system, tool, or other department needs to deliver something to enable that?
Mark fail points as you go, moments where the team says ‘this is where it usually breaks’ or ‘this takes way longer than it should.’ Mark wait times. Mark the handoffs. These annotations are where the actual value lives.
Map Current State Before Future State
Map what actually happens first, not what you wish happened. The temptation is to build an aspirational blueprint, the ideal version of your service. That’s useful eventually, but the diagnostic value comes from mapping reality. You can’t redesign a better backstage if you haven’t honestly documented the current one.
Tie Every Fail Point to an Owner and a Candidate Fix
A blueprint that gets filed without generating decisions is a waste of the morning you spent building it. For every identified fail point, assign an owner and a candidate improvement, even a rough one. The goal isn’t to solve everything in the session; it’s to make sure the diagnosis leads to action rather than a deck nobody looks at again.
Tools
A whiteboard with sticky notes works perfectly for a first blueprint. Digital tools like Miro and Mural have pre-built templates that save setup time. The format matters less than having the right people and being honest about current-state reality. Don’t let tool selection become the bottleneck.
Where the Service Blueprint Earns Its Keep for Small Operators
Large enterprises have entire service design practices. They run multi-week blueprinting engagements with professional facilitators. That’s not the version you need, and honestly, the enterprise version often produces beautiful artifacts that change nothing because they’re too far removed from the people doing the actual work.
For a small operator, the blueprint’s value is more immediate and more direct. Here are the situations where it consistently pays off.
When You’re Scaling a Delivery Process
The most dangerous moment in a service business is when it starts growing faster than the delivery system can handle. What one person managed intuitively for ten clients falls apart at thirty. Roles that were informal and overlapping need to be separated. The blueprint forces you to document what the backstage actually requires before you hire the next person, so that person has something to walk into other than chaos and tribal knowledge.
When You Have a Recurring Problem You Can’t Fix
Customers consistently complain about the same thing. Your team consistently identifies the same friction. You’ve tried three solutions and nothing sticks. That’s usually a sign the fix has been applied in the wrong layer. You keep training frontline staff when the problem is actually a system handoff two layers down. The blueprint shows you which layer needs the intervention.
Before Launching a New Service
Most small operators launch a new service by figuring out the customer-facing experience and then discovering the backstage requirements as problems arise. A blueprint built before launch, even a rough one, forces you to design the operational backbone alongside the customer experience, not after. What systems will you need? Who owns each step? What happens when step four fails? Answering those questions on paper costs far less than answering them with a client waiting.
When You’re Diagnosing Churn
If customers are leaving after a specific phase, after onboarding, after the first delivery, after the first renewal, a blueprint of that phase will almost always reveal a backstage problem the exit survey never captures. Customers don’t say ‘your internal handoff from sales to delivery lost my account context and I felt like a stranger.’ They say ‘things felt disorganized’ or they say nothing and just leave. The blueprint gives you a hypothesis about the operational cause, which you can then test and fix.
When You’re Building SOPs
Standard operating procedures built in isolation, one person writing down what they think the process is, miss dependencies and reality-gaps constantly. A blueprint session with the people who actually do the work produces a far more accurate foundation for SOPs because it surfaces what actually happens, not the idealized version.
The AI Layer
AI tools can accelerate the drafting and analysis phases of blueprinting without replacing the judgment calls. You can use an AI to generate a first-draft swimlane structure for a known service type, to suggest common fail points for a given industry, or to help organize workshop notes into the right layers. What AI won’t do is tell you which problems actually matter, which backstage fix is worth the disruption, or how to manage the politics of showing a team that their process is broken. The diagnosis and the decisions stay with the operator.
Where It Works, Where It Doesn’t
Service blueprinting is genuinely versatile, applied successfully in healthcare, hospitality, logistics, SaaS, financial services, and professional services. But ‘versatile’ doesn’t mean ‘always right.’ There are specific situations where the tool earns its time investment and specific ones where you’d be better off with something lighter.
Where It Works Well
It works best for services that involve multiple touchpoints, multiple people or teams, and multiple systems. The more handoffs a service requires, the more value a blueprint generates, because handoffs are where things break and blueprints are the best available tool for making handoffs visible. A managed IT firm onboarding a new client across five internal teams is a natural fit. A regional restaurant group standardizing its front-of-house and kitchen coordination across locations is a natural fit.
It works well at the redesign phase, when you already know something is broken and you need to decide where to intervene. It also works well before launch, precisely because skipping the blueprint at that stage typically produces a service that looks polished in a demo and falls apart in production once the backstage hasn’t been designed to match the promise.
Where It Struggles, and Why
Highly bespoke, knowledge-intensive engagements are genuinely hard to blueprint usefully. Think: a boutique M&A advisory firm, a custom software build, a complex litigation matter. Every engagement is substantively different, the ‘customer actions’ row shifts with each client, and the backstage tasks are determined by what the work demands rather than by a repeatable process. You can still build a blueprint for the intake-to-kickoff phase, the part that is standardized, but the core delivery work resists it. You end up with a map that covers about 15% of the actual engagement and creates false confidence that you’ve mapped the rest.
It also struggles when the team won’t engage honestly. A blueprinting session where people describe the ideal process rather than the real one produces a diagram of fiction. If your culture punishes people for saying ‘this is broken,’ the blueprint will faithfully reflect that culture, not reality. This is more common than operators admit. A team under pressure tends to narrate the version of events that makes their department look functional. The result is a backstage row that shows a clean, sequential handoff where the actual situation is three people emailing each other for four days with no clear owner.
It’s also the wrong tool for single-department problems. If the failure lives entirely within one team, say, a copywriter who keeps missing deadlines, a blueprint adds complexity without insight. A conversation, a process audit, or a simple workflow map gets there faster. The blueprint earns its overhead when the problem crosses departments and involves systems the customer never sees. When it doesn’t, something lighter does the job.
And it’s a point-in-time snapshot. A blueprint that was accurate eighteen months ago may be describing a business that no longer exists, new systems, new hires, restructured teams. Operators who treat it as a one-time audit rather than a periodic exercise get the worst of both worlds: the effort of building it without the ongoing diagnostic value of maintaining it.
Common Mistakes
- Blueprinting the ideal process instead of the real one — Assign someone the explicit job of asking ‘is that what actually happens or what we wish happened?’ at every backstage step. A practical test: if the step described couldn’t be observed on a Tuesday afternoon without any notice, it probably isn’t real. The fiction is polished and useless. The messy truth is what you can actually fix.
- Scoping the scenario too wide and mapping nothing useful — Teams that try to blueprint ‘the customer lifecycle’ end up with a diagram that looks impressive and diagnoses nothing. One real failure mode: a B2B SaaS company spent two days mapping their entire customer journey end to end, produced a wall-sized artifact, and couldn’t agree on a single fix because no row was granular enough to reveal an actual handoff. Scope to one specific scenario, ‘new client from contract-signed to first value delivered’, and you’ll surface three real problems in ninety minutes.
- Letting the customer actions row reflect your org chart instead of customer behavior — Build that row before anyone mentions internal teams. What does a real customer physically do, step by step? A common tell: if your customer actions row includes steps like ‘customer waits for sales to hand off to onboarding,’ you’ve let the internal structure colonize the row. That’s your process, not their experience. Start over from the customer’s actual sequence.
- Skipping the support processes row because it feels operational rather than strategic — This is the row where quiet failures accumulate. Real example of what gets missed: an agency’s project management tool wasn’t synced to their invoicing system, so every invoice over a certain dollar amount dropped a line item. Clients noticed. The agency thought it was a billing error until a blueprint session revealed it was a data integration gap two layers below anything the account manager could see or control. Map every system dependency and ask what happens when it fails.
- Building the blueprint and filing it — A blueprint without named owners and deadlines is a document, not a decision. Before anyone leaves the room, assign two or three specific fixes to specific people, prioritizing ones that don’t need executive approval. The blueprint that goes up the chain for sign-off before anything changes will almost certainly die there. Move on what you can control now. Early wins build the internal case for the structural fixes that do need buy-in.
Operator’s Take
Here’s the call most blueprinting guides won’t make: the support processes row is where your real margin problems hide, and almost nobody maps it with any rigor. The CRM handoff logic. The subcontractor coordination step. The IT access provisioning that needs to happen before a client’s kickoff call. Nobody’s excited to document that stuff. It feels administrative. But that row, the systems and third parties your team depends on but doesn’t control, is where the quiet failures accumulate and where the fixes with the highest operational ROI tend to live.
So here’s a specific thing to do: for every backstage step in that row, ask two questions before moving on. First, what happens when this system or vendor fails, not if, when? Second, does your customer-facing team even know this dependency exists? In most blueprinting sessions, the answer to the second question is no. That gap between what ops knows and what the front line knows is where the broken promises live.
On triage: annotate every fail point with frequency before you leave the room. Not just severity, frequency. A handoff that breaks on every new client engagement over $10K belongs at the top of your fix list regardless of how unglamorous the fix sounds. The dramatic, rare failure makes the better post-mortem story; the boring one that fires every third time is actually draining your business. Frequency × customer impact is your real prioritization filter. Without it, the squeakiest wheel wins the grease and the structural problem stays structural.
One more thing operators routinely get wrong: they build the blueprint at the wrong level of abstraction. Too high and every step says something like ‘onboarding specialist follows up with client’, which is useless as a diagnostic. You need enough granularity to see the actual handoff moment: who sends what to whom, in which system, triggered by what event. A blueprint that could describe any company in your industry won’t help you find the failure that’s specific to yours.
Before the session ends, assign two or three fixes to named owners, specifically fixes that don’t require executive sign-off. If the blueprint goes up the chain for approval before anything changes, it will almost certainly die there. Start moving on the things you can control today. The wins from those early fixes build the internal case for tackling the structural changes that do need approval.
On AI: use it to draft your initial swimlane template, suggest common fail points for your service category, or turn messy workshop notes into a readable summary. Real time saved. But the calls that matter, which fail points actually drive churn, what each fix will cost operationally, how to sequence changes without breaking what’s already working, those stay with you.
Used in
- ✓ Build a Complete Marketing Department
Used to map the backstage processes, follow-up sequences, handoff protocols, CRM steps, that make customer-facing marketing promises operationally deliverable. - ✓ The Missing Manual for FunnelKit
Applied to trace the automated funnel touchpoints visible to contacts back to the trigger logic, integrations, and data dependencies that must work correctly below the line of visibility. - ✓ The Missing Manual for Make
Used to identify which manual handoffs and backstage steps are candidates for automation, the support processes swimlane maps directly onto Make’s module architecture.
FAQ
How is a service blueprint different from a customer journey map?
A customer journey map documents the customer’s experience, what they do, feel, and need at each touchpoint. A service blueprint takes that same journey and adds every backstage process, employee action, system, and handoff that produces it. Journey maps answer ‘what does the customer experience?’ Blueprints answer ‘how does our operation produce that experience?’ You usually want both, in that order.
Do I need a consultant or special software to build one?
No. A whiteboard, sticky notes, and two hours with the right people in the room is all you need for a first blueprint. Digital tools like Miro and Mural have pre-built templates if you want to work asynchronously or remotely, but the tool itself requires no specialized software.
How long does it take to build a service blueprint?
A focused session mapping one specific customer scenario typically takes two to four hours with four to six people. Allow additional time afterward to clean up the output, assign fail-point owners, and decide on next actions. Plan for a half-day total the first time you run one.
What is a fail point in a service blueprint?
A fail point is a specific moment in the service process, almost always in the backstage, where the operation reliably breaks down and the customer eventually feels the consequence. Marking fail points is the primary diagnostic output of a blueprinting session, and fixing them is the primary operational output.
Can service blueprinting apply to a product business or SaaS company?
Absolutely. Any business with onboarding, support, billing, or renewal processes has service layers that can and should be blueprinted. SaaS companies in particular benefit from blueprinting their onboarding sequence, it almost always reveals backstage handoffs and system dependencies that lengthen time to value and drive early churn.
How often should I update a service blueprint?
Revisit it whenever your team structure, delivery process, or core systems change significantly. A blueprint that was accurate eighteen months ago may not reflect your current operation at all. Many operators find an annual review sufficient; faster-changing businesses benefit from revisiting specific sections quarterly.
Further reading
- ‘Designing Services That Deliver’G. Lynn Shostack, Harvard Business ReviewJanuary, February 1984 (Vol. 62, No. 1, pp. 133 to 139). The original article that introduced the concept and the line of visibility. Worth reading for the shoe-shine example alone, Shostack shows how much diagnostic clarity even a stripped-down map can provide.
- ‘Service Blueprinting: A Practical Technique for Service Innovation’Mary Jo Bitner, Amy L. Ostrom, and Felicia N. Morgan, California Management ReviewVol. 50, No. 3, Spring 2008, pp. 66 to 94. The peer-reviewed expansion of Shostack’s framework into the five-component model most practitioners use today; includes real case examples across multiple industries.
- NN/g’s Service Blueprint resources (nngroup.com), Nielsen Norman Group maintains some of the most practically useful public-facing guides on blueprinting, including the ‘Fails and Fixes’ piece based on survey data from 97 UX practitioners.
Sources: G. Lynn Shostack, ‘Designing Services That Deliver,’ Harvard Business ReviewVol. 62, No. 1, January, February 1984, pp. 133 to 139. Mary Jo Bitner, Amy L. Ostrom, and Felicia N. Morgan, ‘Service Blueprinting: A Practical Technique for Service Innovation,’ California Management ReviewVol. 50, No. 3, Spring 2008, pp. 66 to 94 (DOI: 10.2307/41166446). Nielsen Norman Group, ‘Service Blueprints: Definition’ and ‘Service Blueprinting: Fails and Fixes’ (nngroup.com). SI Labs, ‘Service Blueprint: Definition, Components, Workshop Guide & Practical Example’ (si-labs.com, February 2026). Smaply, ‘Service Blueprint: A Practical Guide to Creating One’ (smaply.com, June 2026). Strategic Management Insight, ‘Service Blueprinting Explained in Depth’ (strategicmanagementinsight.com, May 2025).
Brian Kasday spent forty years in direct-response marketing before rebuilding the whole operation as a one-person shop. He writes The Operator’s Library — including “Build a Complete Marketing Department” — for operators who’d rather build it themselves than wait on someone else.
Build the department these ideas describe — the free companion kit: mmsvegas.com/resources.
More The Operator's Canon guides
Free · Operator Toolkit
Want the tools, not just the guide?
Get the free operator toolkit — templates and checklists for the systems you actually run, plus a note when this guide changes.
Get the free toolkit →How to cite: Service Blueprinting. Associated with G. Lynn Shostack, 1984. The Operator’s Canon, MMS Vegas. https://mmsvegas.com/library/service-blueprinting-explained/